
Goodness of Fit
So far, we have no way of measuring how well the explanatory or independent variable, X, explains the dependent variable, Y. In other words, we must know how well the OLS regression line fits the data. Are the observations tightly clustered around the regression line, or are they spread out? Two most commonly used measures of how well the OLS regression line fits the data are:
- Standard Error of Estimate of Regression (SEE or SER)
- Coefficient of Determination, R2
Standard Error of Estimate or Regression (SEE or SER)
Standard error of estimate of regression is a measure of goodness of fit. It is the standard deviation of the values of actual Y around the regression line. SER is a measure of the spread of the observations around the regression line, measured in the units of the dependent variable. It is square root of the variance of residuals. The closer the sample values to regression line smaller will be the standard error of regression.

Coefficient of Determination, 
The coefficient of determination is a measure of goodness of fit of regression line. It tells us how accurately sample regression line fits the data. It measures the percentage of the total variation of the dependent variable Y that can be explained by the independent variable, X. It ranges between 0 to 1.
Some Important Points About
- can never be negative because sum of deviations is always positive.
- It ranges between 0 to 1.
- If all sample values lie exactly on the sample regression line than would be equal to 1.
- If is equal to zero than none of the variation in Y is explained by our model (independent variables).
- The higher the , the greater is the goodness of fit of the estimated sample regression line.
- The scatter the data, the lower the value.
Formula of

Understanding Through Venn Diagram
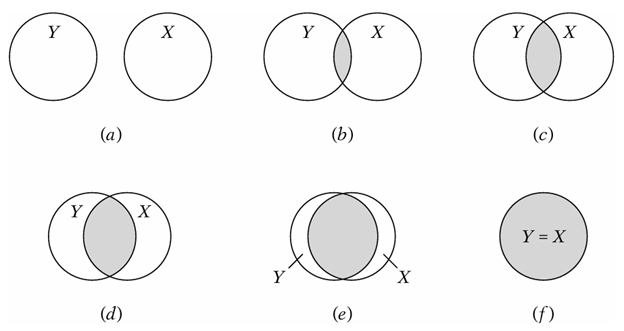
In the figure the circle Y represent variations in dependent variable, and the circle X represents variation in the explanatory variable X. The overlap of the two circles (the shaded area) indicates the extent to which the variation in Y is explained by the variation in X (say, via an OLS regression). The greater the extent of the overlap, the greater the variation in Y is explained by X. The  is simply a numerical measure of this overlap. As you can the overlap increases as we move from top left bottom right. When there is no overlap then is equal to zero. It means none of variation in Y is due to X. If the overlap is complete than is equal to 1 which is the rare case.
Types of Variations in Regression
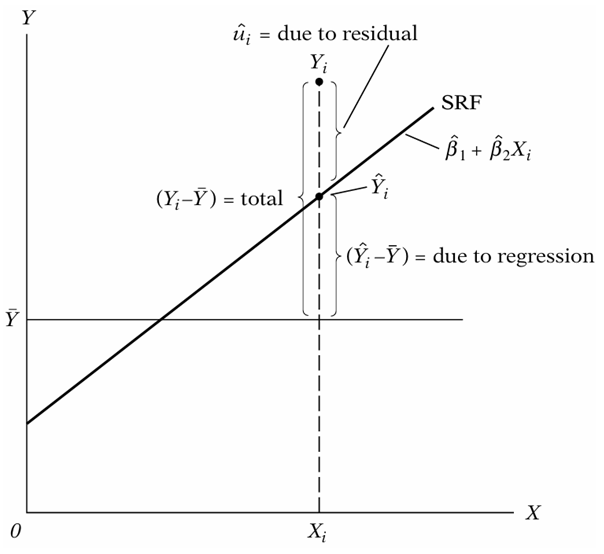
The figure shows that total variation in Y from mean is divided into two components. Portion of variation of Y explained by X variables known as explained variation. Portion of variation of Y not explained by X variables known as unexplained variation. These variations are explained in detailed below.
Total Variation or Total Sum of Squares (TSS)
Total variation or total sum of squares (TSS) is the sum of squared deviations of Y from its mean. In fact, it is the sum of explained variation (ESS) and unexplained variation (RSS). TSS has n-1 degrees of freedom since we lose 1 df in computing the sample mean, hat is,


Explained Variation or Explained Sum of Squares (ESS)
Explained variation or explained sum of squares or regression sum of square is the variation in dependent variable Y that is explained by our regression model. It is the sum of squared deviation of the predicted Y from its average. ESS has degrees of freedom 1. It is written as:

Unexplained Variation or Sum of Squared Residuals (RSS)
Unexplained variation or residual sum of square (RSS) is the variation in Y that is not explained by our regression model. It is the sum of squared difference between actual Y and estimated Y. RSS has n-2 degrees of freedom in two variable case with intercept. It is written as:

Degrees of Freedom (df)
Degrees of freedom (df) refers to the total number of independent observations out of a total of n observations. It is calculated by the difference between total observations (n) and total number of parameters (k),  .
.
Suggestions for further reading:
