
In this post we will discuss measures of poverty and inequality.
What is Poverty?
Poverty can be defined in two ways, absolute poverty and relative poverty. In ordinary language when we ask about poverty, we often mean absolute poverty. But what it is?
United Nations define poverty as:
A condition characterized by severe deprivation of basic human needs, including food, safe drinking water, sanitation facilities, health, shelter, education and information. It depends not only on income but also on access to services.
World Bank defines poverty as:
Poverty is pronounced deprivation in well-being and comprises many dimensions. It includes low incomes and the inability to acquire the basic goods and services necessary for survival with dignity.
In simple words we can define absolute poverty/poverty as:
Absolute poverty is the situation where people are unable or only barely able to meet the basic necessities of life such as food, water, clothing, and shelter. (Michael P. Todaro)
How is Absolute Poverty Measured?
World Bank measures poverty using absolute poverty line. Absolute Poverty line is the minimum level of income required to meet the basic necessities of life like food, clothing, and shelter. Nowadays, international poverty line set for low-income countries by World Bank is USD 3 by June 2025. To view the history of global poverty lines, click on Measuring Poverty Overview.
Measures of Poverty
- Headcount Index (H/N)
- Total Poverty Gap (TPG)
- Average Poverty Gap (APG)
- Normalized Poverty Gap (NPG)
- Average Income Shortfall (AIS)
- Normalized Income Shortfall (NIS)
Headcount Index (H/N)
Headcount (H) refers to the number of people in a country whose income fall below the absolve poverty line Yp. Headcount ratio (H/N) is the proportion of total population living below the absolute poverty line. It is also called headcount index.
Example:
- f Population (N)=50
- Poverty line is USD 3
- No. of people whose income lies below USD 3=35
- Then Headcount (H)=35
- Headcount Index (H/N) = 35/50=0.7 or 70%
Total Poverty Gap (TPG)
Total Poverty Gap (TPG) measures the total amount of income necessary to raise everyone who is below the poverty line. It is defined as the sum of the difference between the poverty line and actual income levels of all people living below that line.

Example:
- Poverty line=USD 3
- Person A earns USD 4, Person B earns USD 2, Person C earns USD 1
- TPG = (3-2) +(3-1) =1+2= USD 3
The result means that a total of 3 USD would be required to bring all poor individuals exactly up to the poverty line
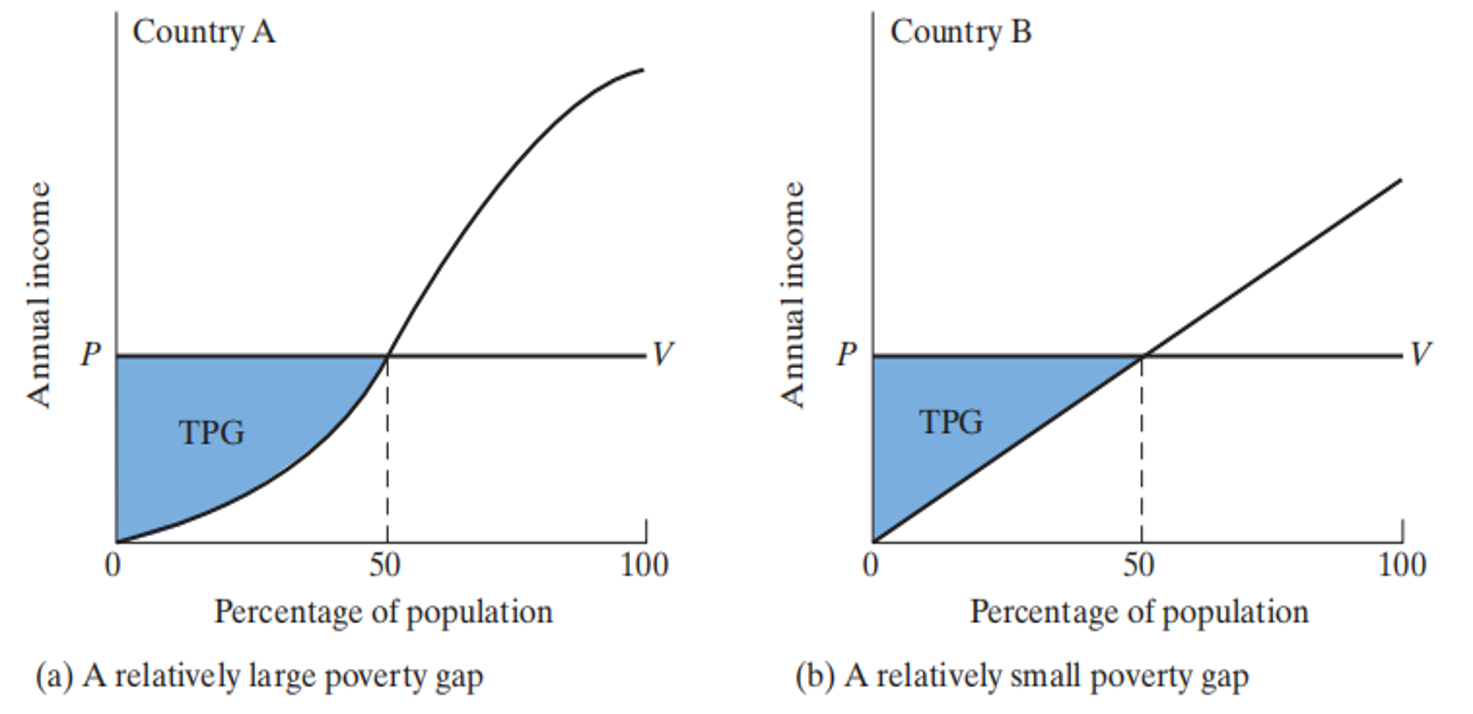
Below figure shows that even though in both countries A and B, 50% of the population falls below the same poverty line, the TPG in country A is greater than in country B.
Average Poverty Gap (APG)
If we divide the total poverty gap by the total population, we get Average Poverty Gap. This tells us how far each individual is from poverty line.

Example:
- TPG=3 USD
- N=3
- APG=TPG/N=1
This means that each individual person is 1 USD far from poverty line.
Normalized Poverty Gap (NPG)
Normalized Poverty Gap is equal to the average poverty gap divided by poverty line. Its value lie between 0 and 1. It is useful when we want to compare poverty gaps in two countries.

Average Income Shortfall (AIS)
Average Income Shortfall (AIS) is the total poverty gap divided by headcount of the poor. The AIS tells us the average amount by which the income of a poor person falls below the poverty line.

Normalized Income Shortfall (NIS)
Normalized Income Shortfall (NIS) is the average income shortfall divided by the poverty line.

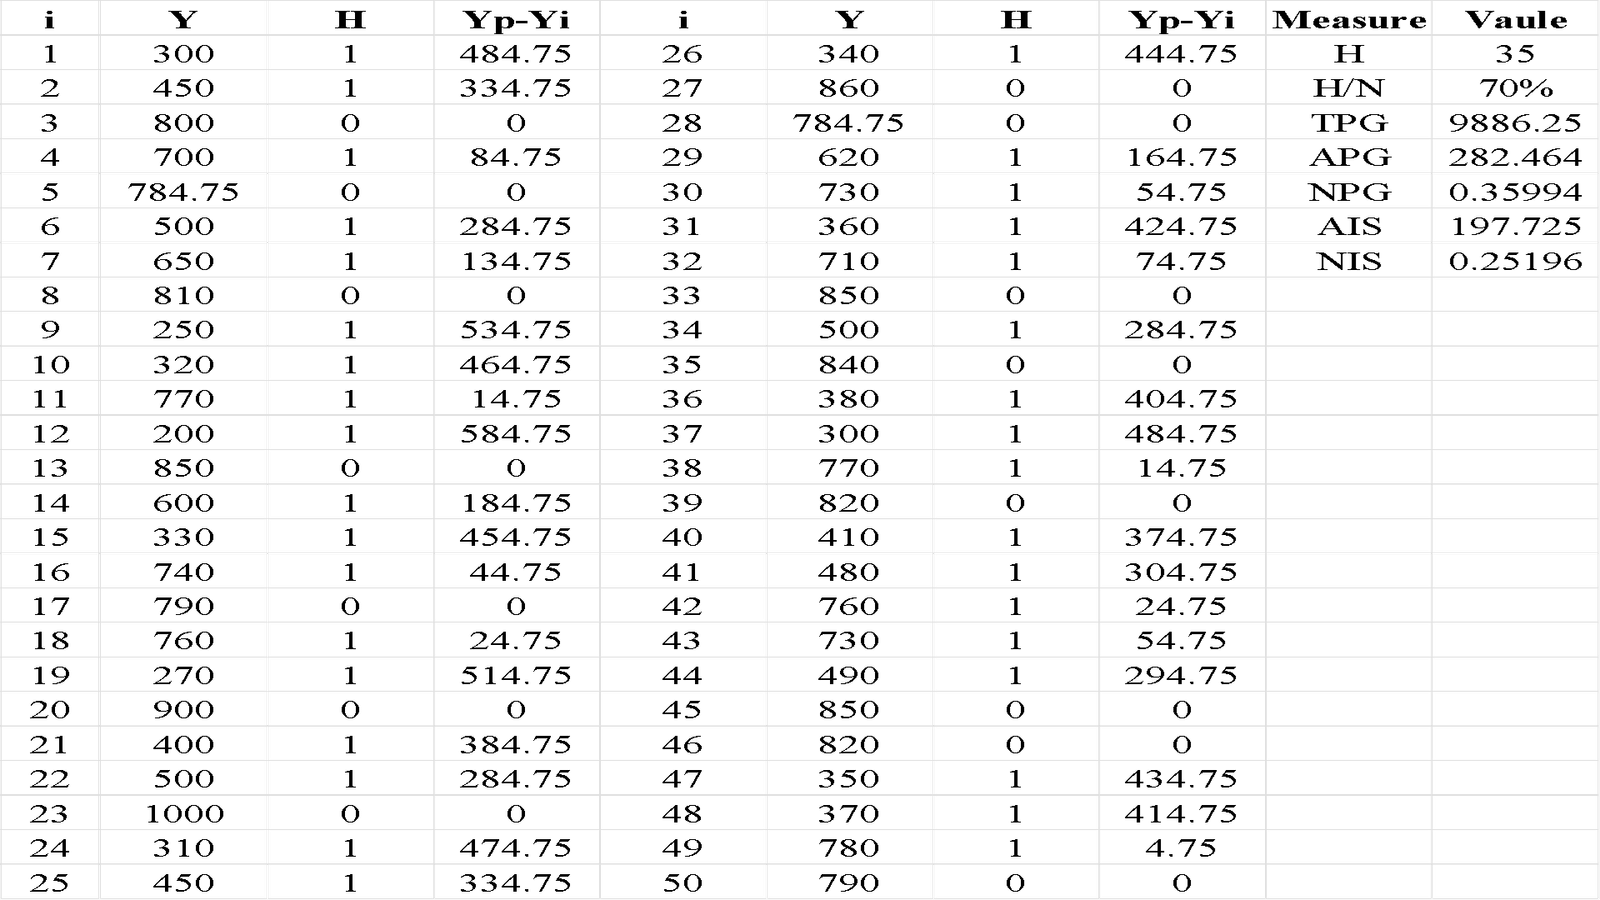
An Example
To understand these concepts clearly let’s take an example of 50 individuals given in the table below.
- No. of individuals=50
- Poverty line= USD 784.75 per annum
- No. of individuals below poverty line=35
Table 1: Data on income of 50 individuals
Relative Poverty
Relative poverty refers to a situation in which an individual`s income falls below a certain percentage of the median national income. For example, if the median income in a country is USD 100, and the individual is earning $60, then he/she is considered to be in relative poverty. In the United States, the average yearly income is USD 50,000. 60% of 50,000 equals 30,000 dollars. That means anybody who makes less than USD 30,000 per year would fall into the relative poverty category.
Multidimensional Poverty Index (MPI)
Multidimensional Poverty Index (MPI) is a composite index of measuring multidimensional poverty. It has three dimensions: health; measured by nutrition and child mortality, education; measured by years of schooling and attendance, and standard of living; measured by six indicators. Each dimension is given equal weights.
Table 2: Multidimensional Poverty Index
| Dimensions | Indicator | Deprived if living in the household where… | Weight |
| Health | Nutrition | Any adult under 70 years of age or any child for whom there is nutritional information is undernourished. | 1/6 |
| Child mortality | Any child under the age of 18 years has died in the family in the five-year period preceding the survey. | 1/6 | |
| Education | Years of schooling | No household member aged ‘school entrance age + six years or older has completed at least six years of schooling. | 1/6 |
| School attendance | Any school-aged child is not attending school up to the age at which he/she would complete class eight. | 1/6 | |
| Standard of Living | Cooking Fuel | The household cooks with dung, wood, charcoal or coal. | 1/18 |
| Sanitation | The household’s sanitation facility is not improved (according to SDG guidelines) or it is improved but shared with other households. | 1/18 | |
| Drinking Water | The household does not have access to improved drinking water (according to SDG guidelines) or improved drinking water is at least a 30-minute walk from home, round trip. | 1/18 | |
| Electricity | The household has no electricity. | 1/18 | |
| Housing | At least one of the three housing materials for roof, walls and floor are inadequate: the floor is of natural materials and/or the roof and/or walls are of natural or rudimentary materials. | 1/18 | |
| Assets | The household does not own more than one of these assets: radio, television, telephone, computer, animal cart, bicycle, motorbike or refrigerator, and does not own a car or truck. | 1/18 |
Source: 2025 Global Multidimensional Poverty Index (MPI) | Human Development Reports
Income Distribution
Income distribution means how a nation’s total GDP is distributed amongst its population. It’s a measure of economic equality/inequality. Economists usually distinguish between two measures of income distribution: the personal or size distribution of income and the functional distribution.
Functional distribution of Income
Functional distribution is also called factor wise distribution of income or output. It measures the percentage of total income that each factor of production such as land, labor, capital, and organisation receives in the form of rent, wages, interest, and profit irrespective of the ownership of factors.
For example, the percentage of income received by labor compared to the percentage of total income received by other factors of production. The income or price of each factor of production is determined in their respective markets such as wages are determined in labor market, and interest is determined in capital market etc.
Personal Distribution of Income
The personal or size distribution measures the percentage share of total national income received by various income groups. For example, share of income of poorest 10% in the population or share of income of richest 10% in the population.
It measures distribution of income regardless the source of income. Whether the income is earned through fair means or unfair means, from occupational sources (agriculture, manufacturing, or services) or from other sources (interest, profits, rents, gifts, or inheritance).
In size distribution individuals are arranged in ascending personal incomes and then divided into distinct groups such as quintiles or deciles then determine what proportion of the total national income is received by each income group.
Quintile: 20% proportion that is 1/5, it divides a population in 5 groups of equal sizes. Decile: 10% proportion that is 1/10, it divides a population in 10 groups in equal sizes.
Table 2 shows total population of 20 individuals divided into quintiles as well as deciles, total national income is 100 monetary units. The population ranges from lowest income individual (0.8 units) and highest income individual (15 units).
In column 3, first quintile shows bottom 20% of population on income scale, this is poorest 20% who receives only 5% of the total national income. The second quintile receives 9% of the total national income.
Table 3: Income Distribution
| Individuals | Personal Income | Share of Total Income (%) | |
| Quintiles | Deciles | ||
| 1 | 0.8 | 5 | 1.8 |
| 2 | 1.0 | ||
| 3 | 1.4 | 3.2 | |
| 4 | 1.8 | ||
| 5 | 1.9 | 9 | 3.9 |
| 6 | 2.0 | ||
| 7 | 2.4 | 5.1 | |
| 8 | 2.7 | ||
| 9 | 2.8 | 13 | 5.8 |
| 10 | 3.0 | ||
| 11 | 3.4 | 7.2 | |
| 12 | 3.8 | ||
| 13 | 4.2 | 22 | 9.0 |
| 14 | 4.8 | ||
| 15 | 5.9 | 13.0 | |
| 16 | 7.1 | ||
| 17 | 10.5 | 51 | 22.5 |
| 18 | 12.0 | ||
| 19 | 13.0 | 28.5 | |
| 20 | 15.0 | ||
| Total National Income | 100.0 | 100.0 | 100 |
Income Inequality
Income inequality refers to the uneven distribution of total national income among households or income groups. It can be measured using Kuznets ratio, Lorenz curve and Gini coefficient.
Kuznets Ratio
In sum bottom 40% (quintile 1+2) receives 14% of the total national income, while the top 20% (the fifth quintile) of the population receives 51% of the total national income. A common measure of income inequality is the Kuznets Ratio. Kuznets Ratio is used as a measure of degree of income inequality between high- and low-income groups in a country. It is named after a Nobel Laureate Simon Kuznets.
It is the ratio of incomes received by top 20% and bottom 40% of the population. It is also called ratio of extremes. Because it measures inequality by dividing the incomes of extreme income groups. In our example, Kuznets ratio is equal to 51% divided by 14%, which 3.64.

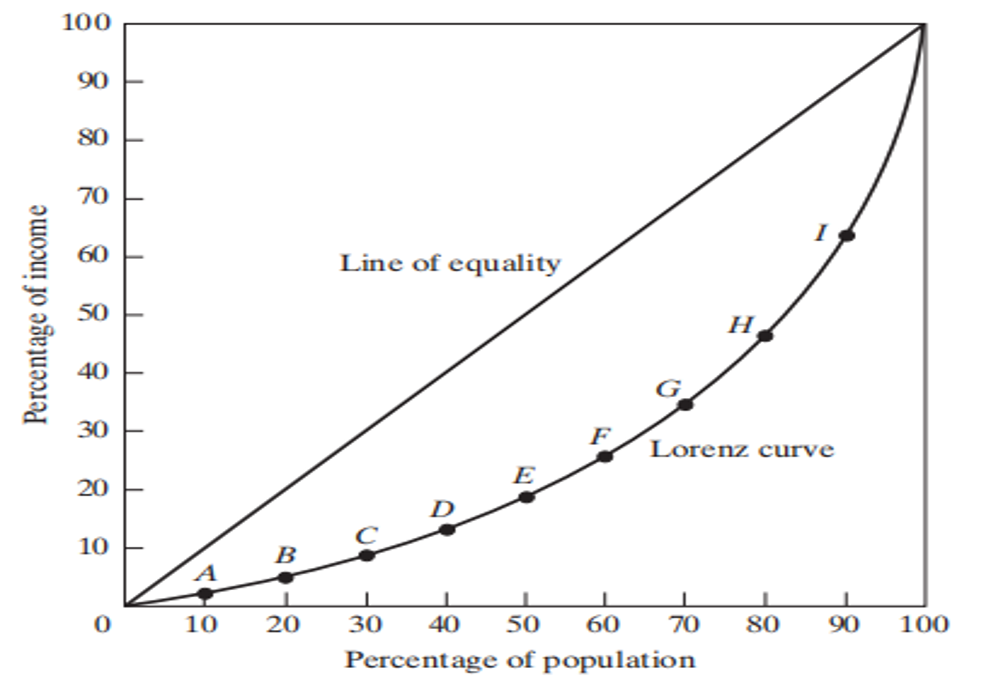
Lorenz Curve
The Lorenz curve is a graphical method to measure inequality. It shows the actual quantitative relationship between the percentage of income recipients and the percentage of the total income they receive during given year. Lorenz Curve was devised by an American Economist Max Otto Lorenz in 1905.
In the Lorenz curve, horizontal axis shows cumulative percentages of population and vertical axis shows cumulative percentage of income. Then we divide both the axis into ten equal segments corresponding to each of the ten decile groups (see table 2).
Point A shows that the bottom 10% of the population receives only 1.8% of the total income, point B shows that the bottom 20% is receiving 5% of the total income, and so on for each of the other eight cumulative decile groups. Note that at the halfway point, 50% of the population is in fact receiving only 19.8% of the total income.
Figure 1: Lorenz Curve
In Lorenz curve perfect equality line shows perfectly equal distribution of income such that the percentage of income receive is exactly equal to the percentage of income recipients. For example, bottom 10% of population receives 10% of the total income, bottom 20% of population receives 20% of the total income, the first half (lower 50%) receives 50% of the total income, ¾ of the population receives 75% of the total income and top 10% receives 10% of the total income. In this way, every person in the country has same level of income, it is called perfect equality in income distribution. It is shown in figure 1.
Figure 2: Lorenz Curve for Two Different Income Distributions
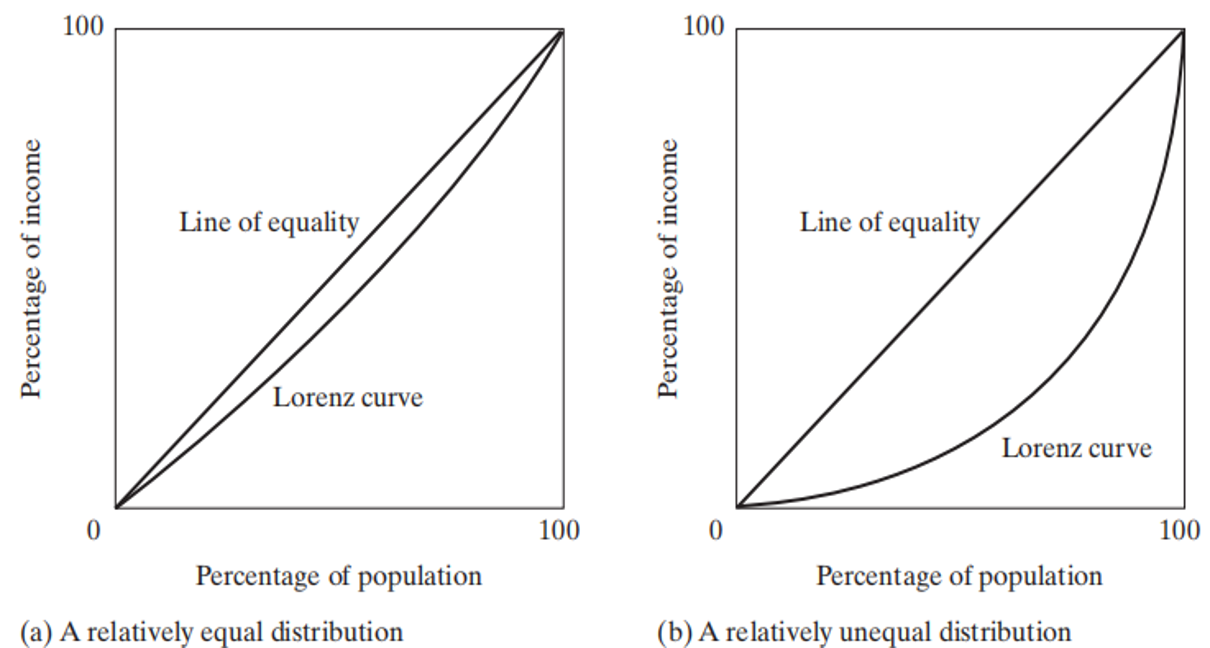
The more the Lorenz line curves away from the diagonal (line of perfect equality), the greater the degree of inequality represented. The extreme case of perfect inequality (i.e., a situation in which one person receives all of the national income while everybody else receives nothing).
In this case, Lorenz curve would be represented by the congruence with the bottom horizontal and right-hand vertical axes. Because no country exhibits either perfect equality or perfect inequality in its distribution of income, the Lorenz curves for different countries will lie somewhere to the right of the diagonal.
Figure 3: Four Possible Lorenz Curves
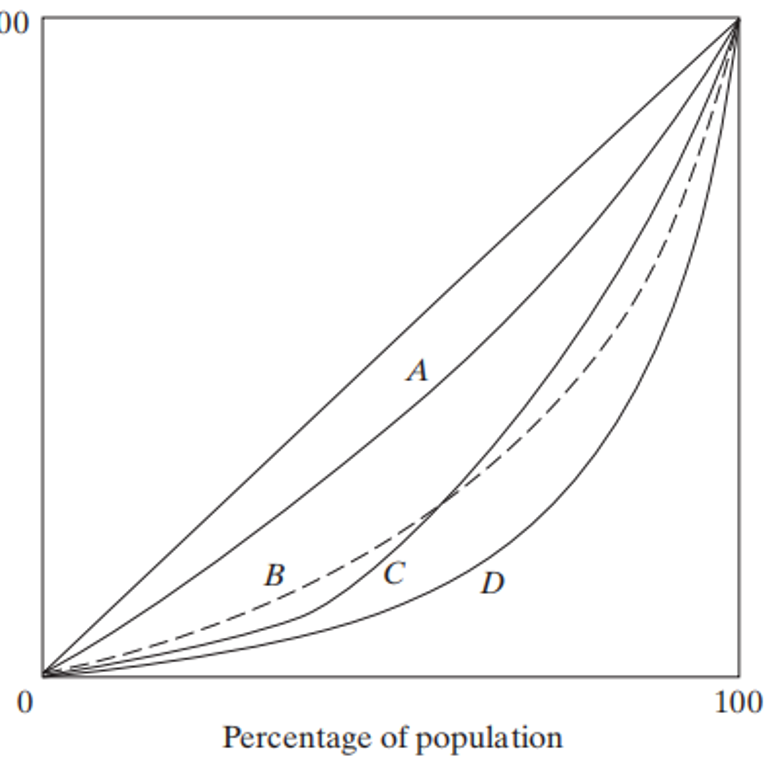
Figure 3 shows four possible Lorenz curves that can be found in international data. In the “Lorenz criterion” of income distribution, whenever one Lorenz curve lies above another Lorenz curve, the economy corresponding to the upper Lorenz curve is more equal than that of the lower curve. Thus, economy A may be said to be more equal than economy D.
Whenever two Lorenz curves cross, such as curves B and C, the Lorenz criterion states that we “need more information” or additional assumptions. For example, if we are interested in addressing the problems of poverty than curve B represents a more equal economy.
(Can you explain why the Lorenz curve could not lie above or to the left of the diagonal at any point?)
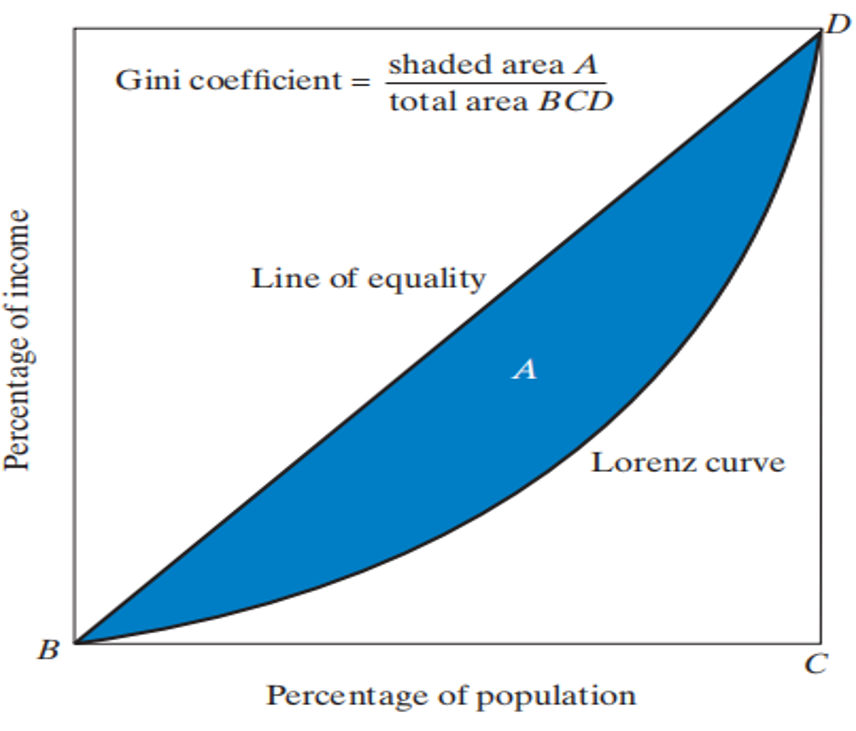
Gini Coefficient
Gini Coefficient is a numerical measure of income inequality. It ranges from 0 to 1. 0 means perfect equality and 1 means perfect inequality. The higher the value of the coefficient, the higher the inequality of income distribution. It is also known as Gini Concentration or Gini Index developed by Italian statistician Corrado Gini in 1912.
Gini Coefficient can be measured graphically by dividing the area between the perfect equality line and the Lorenz curve by the total area lying to the right of the equality line in a Lorenz diagram. In figure 3 (next slide), this is the ratio of the shaded area A to the total area of the triangle BCD
Figure 4 Gini Coefficient
Properties of Gini Coefficient
- Anonymity: The first property of Gini-Coefficient is Anonymity which means that it measures inequality irrespective of the ways and means of sources. For example, it does not matter whether the rich has higher income due to interest, lottery, rent, gifts, or inheritance and poor has lower income due to absence of these sources.
- Scale Independence: Gini coefficient does not affect by the units in which income is measured whether in dollars, euros, rupees or riyal.
- Population Independence: The Gini coefficient does not depend on the size or population of the economy. It is because Gini coefficient measure the quantitative relationship the percentage of income recipients and percentage of income not the actual amount of income and recipients.
- Transfer Principle: It is also called Pigou Dalton Principle. It states that if we transfer some amount of income from richer to poorer person but not much that the poorer becomes richer and richer becomes poorer, than it shows more equal distribution.
Kuznets Curve
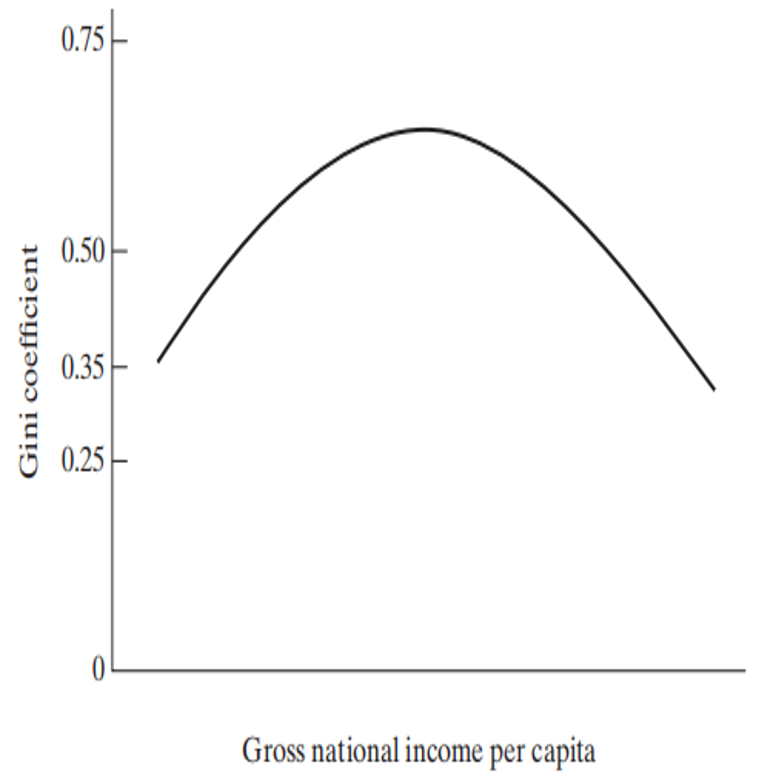
Kuznets hypothesis or Kuznets curve suggests that as an economy develops, income inequality initially increases and then decreases, forming an inverted U-shaped curve when plotted between income inequality (on the y-axis) and per capita income (on the x-axis). At early stages of economic growth, income inequality increases, after reaching a maximum point inequality starts to decline.
Suggestions for further reading:
