

Demand and Law of Demand in Economics: Complete Guide with Examples
Demand is one of the fundamental concepts of economics. It explains how much of a good or service consumers are willing and able to purchase at different prices during a particular period. The law of demand explains the usual inverse relationship between a product’s price and its quantity demanded, other things remaining constant.
This guide covers the meaning of demand, the difference between desire and demand, demand schedules and curves, the law of demand, movements and shifts in the demand curve, determinants of demand, and practical economic examples.
Meaning and Definition of Demand
In ordinary language, demand may mean wanting to buy something. In economics, however, demand has a more precise meaning. A consumer must want a product, have the ability to pay for it, and be willing to purchase it at a particular price and during a specified period.
Definition: Demand refers to the quantity of a good or service that consumers are willing and able to buy at different prices during a given period, other things remaining constant.
For example, a student may want to purchase a laptop worth Rs. 100,000. If the student cannot afford it and has no means to purchase it, that desire does not constitute effective demand in the economic sense.
Similarly, if a household is willing and able to purchase 5 kilograms of sugar per month at Rs. 150 per kilogram, that planned purchase represents demand at the stated price and period.
Essential elements of demand
- Desire: The consumer wants the good or service.
- Willingness to pay: The consumer is prepared to purchase it at the stated price.
- Ability to pay: The consumer has sufficient purchasing power.
- Price: Demand is considered in relation to a particular price.
- Time period: The quantity demanded must refer to a defined period, such as a day, week, or month.
Difference Between Desire and Demand
Desire and demand are related concepts, but they are not identical. Desire means wanting a product, whereas demand in economics requires willingness and purchasing ability at a given price.
| Basis | Desire | Demand |
|---|---|---|
| Meaning | Wanting to possess or use a product | Willingness and ability to purchase a product at a given price |
| Purchasing power | Not necessary | Necessary |
| Willingness to buy | May not be supported by a purchase plan | Must be supported by willingness to purchase |
| Economic significance | May not affect market transactions | Helps determine market demand and sales |
| Example | A person wants an expensive car but cannot afford it | A person is willing and able to buy a car at the quoted price |
Key point: Desire is a necessary element of demand, but desire alone is not sufficient to constitute economic demand.
Demand Function
A demand function expresses the relationship between quantity demanded and the factors that influence it. These factors include the product’s own price, consumer income, prices of related goods, tastes, and other relevant conditions.

Where:
 : Quantity demanded
 : Price of the good itself
 : Consumer income
 : Prices of related goods
 : Consumer tastes and preferences
 : Number of consumers
- : Consumer expectations about future prices and income
 : Quantity demanded
 : Price of the good itself
 : Consumer income
 : Prices of related goods
 : Consumer tastes and preferences
 : Number of consumers
 : Consumer expectations about future prices and income
The function indicates that quantity demanded can change when any relevant determinant changes. The effect of a determinant depends on the nature of the good and the circumstances of consumers.
Individual demand and market demand
Individual demand refers to the quantity demanded by one consumer at different prices. Market demand is the total quantity demanded by all consumers in a market at each price, assuming the same time period and market conditions.

Here,  represent the quantities demanded by individual consumers, while
 represents total market demand.
Demand Schedule
A demand schedule is a table showing the quantities of a good that consumers are willing and able to purchase at different prices during a specified period, other things remaining constant.
Example: Monthly demand for tea
Suppose a household’s monthly demand for tea is represented by the following hypothetical schedule:
| Price per unit (Rs.) | Quantity demanded per month (units) |
|---|---|
| 100 | 10 |
| 80 | 20 |
| 60 | 30 |
| 40 | 40 |
| 20 | 50 |
The schedule shows that the household purchases a larger quantity when the price falls. At Rs. 100, the household demands 10 units, whereas at Rs. 20, it demands 50 units per month.
This is an illustrative example, not a survey of actual household purchases. It demonstrates the usual inverse relationship between price and quantity demanded.
Demand Curve
A demand curve is a graphical representation of the relationship between the price of a good and the quantity demanded, assuming other relevant factors remain constant.
In the conventional demand diagram:
- Price is measured on the vertical axis.
- Quantity demanded is measured on the horizontal axis.
- The demand curve generally slopes downward from left to right.
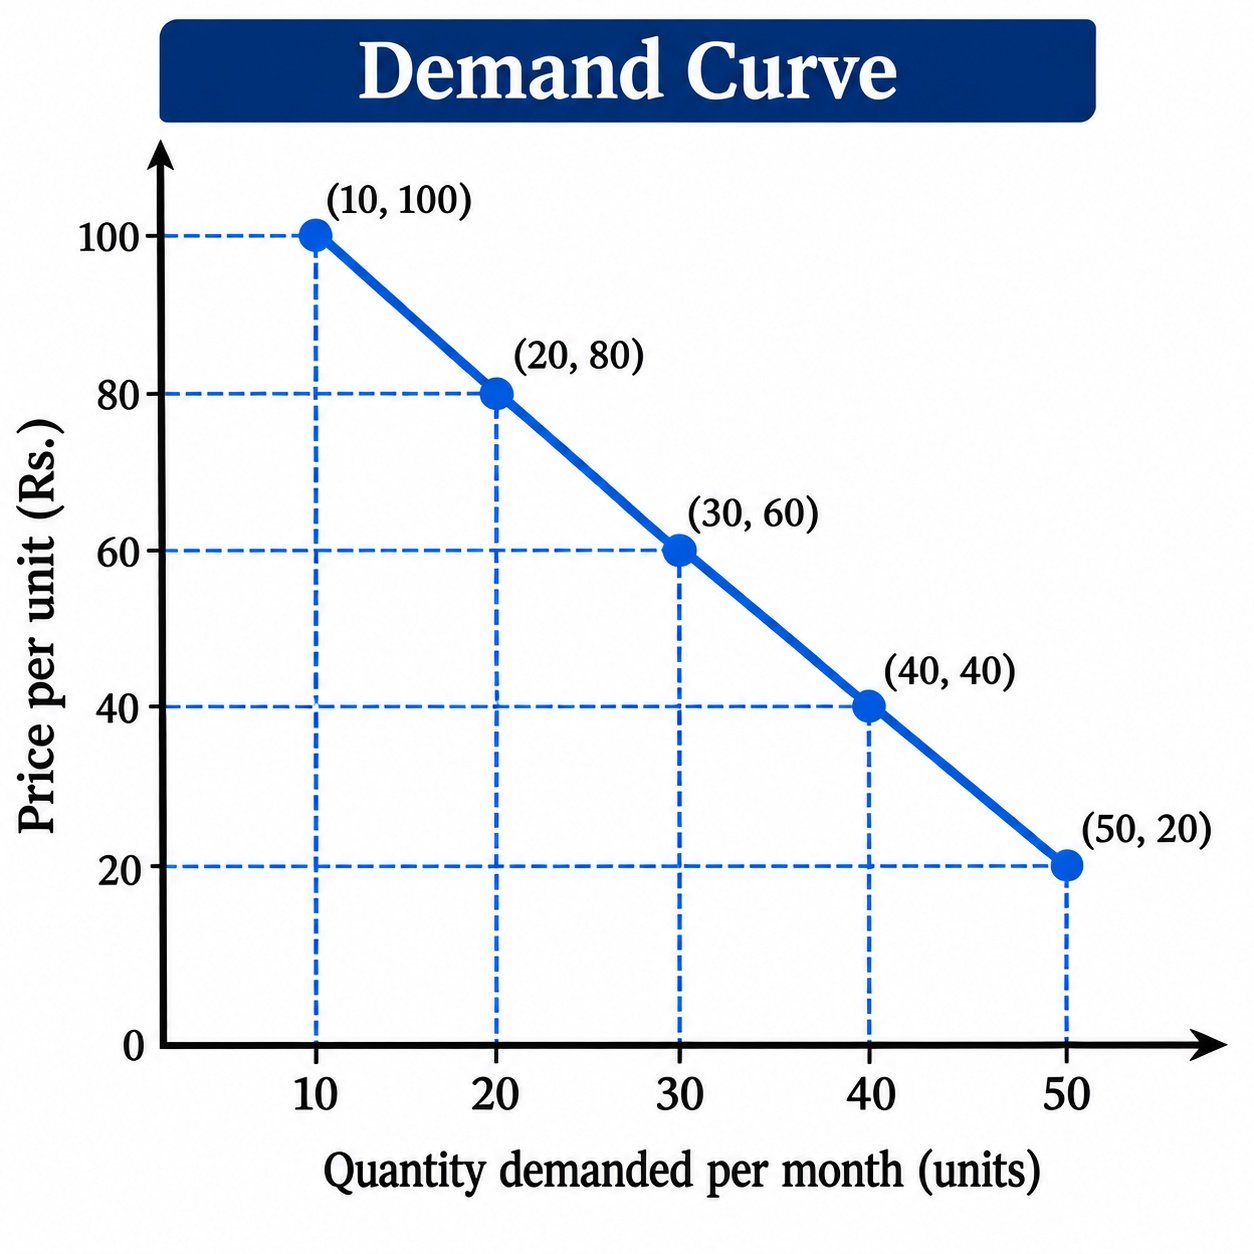
Figure 1: A conventional demand curve. As price decreases, quantity demanded increases, other things remaining constant.
Moving from left to right downward along the same demand curve represents an increase in quantity demanded due to a fall in price. Moving in the opposite direction represents a decrease in quantity demanded due to a rise in price.
Law of Demand
Statement of the law of demand: Other things remaining constant, quantity demanded of a good generally increases when its price falls and decreases when its price rises.
The law describes an inverse relationship between a good’s own price and its quantity demanded, holding other determinants constant. This assumption is commonly expressed as ceteris paribus, meaning “other things being equal.”
For example, if the price of a particular brand of biscuits falls while income, preferences, and the prices of alternatives remain unchanged, consumers may buy more biscuits. If its price rises, they may buy fewer.
Mathematical representation
The law of demand can be represented using a simple linear demand equation:

Where:
- is quantity demanded.
- is the price of the good.
 is the intercept parameter.
 is a positive parameter representing the magnitude of the price effect.
 is the intercept parameter.
 is a positive parameter representing the magnitude of the price effect.
Since  , the coefficient of price is negative. Therefore, an increase in price reduces predicted quantity demanded in this simple model, while a decrease in price increases it.
This is a simplified demand equation. Actual demand relationships may be nonlinear, and the relationship may differ for unusual goods or under particular market conditions.
Why Does the Demand Curve Slope Downward?
The usual downward slope of the demand curve can be explained by several economic principles.
Law of diminishing marginal utility
Marginal utility is the additional satisfaction a consumer obtains from consuming one more unit of a good. Under the law of diminishing marginal utility, the additional satisfaction from successive units generally decreases, other things remaining constant.
Consequently, consumers may be willing to purchase additional units only at a lower price. This helps explain why the quantity demanded often increases as price falls.
Substitution effect
When the price of a good falls relative to the prices of substitutes, the good becomes relatively cheaper. Consumers may substitute it for other goods.
For example, if the price of one brand of cooking oil falls while competing brands maintain their prices, some consumers may switch toward the cheaper brand.
Income effect
A fall in the price of a good increases the purchasing power of a consumer’s money income, allowing the consumer to buy more with the same budget. For a normal good, this purchasing-power effect generally increases quantity demanded.
New buyers enter the market
At a lower price, consumers who previously considered a product too expensive may begin purchasing it. This can increase total market quantity demanded.
Multiple uses of a good
Some goods have several uses. When their prices fall, consumers may use them for additional purposes. For example, a lower electricity tariff may encourage greater use of electricity-consuming appliances, depending on the circumstances.
Together, these explanations help explain why the demand curve is generally downward sloping. They do not imply that every product must always follow this pattern.
Movement Along the Demand Curve vs. Shift of the Demand Curve
This distinction is essential in economics. A change in the product’s own price generally causes a movement along the existing demand curve. A change in another determinant of demand generally shifts the entire curve.
Movement along the demand curve
A movement occurs when the product’s own price changes while other relevant determinants remain constant.
- Expansion of demand: A fall in price increases quantity demanded.
- Contraction of demand: A rise in price decreases quantity demanded.
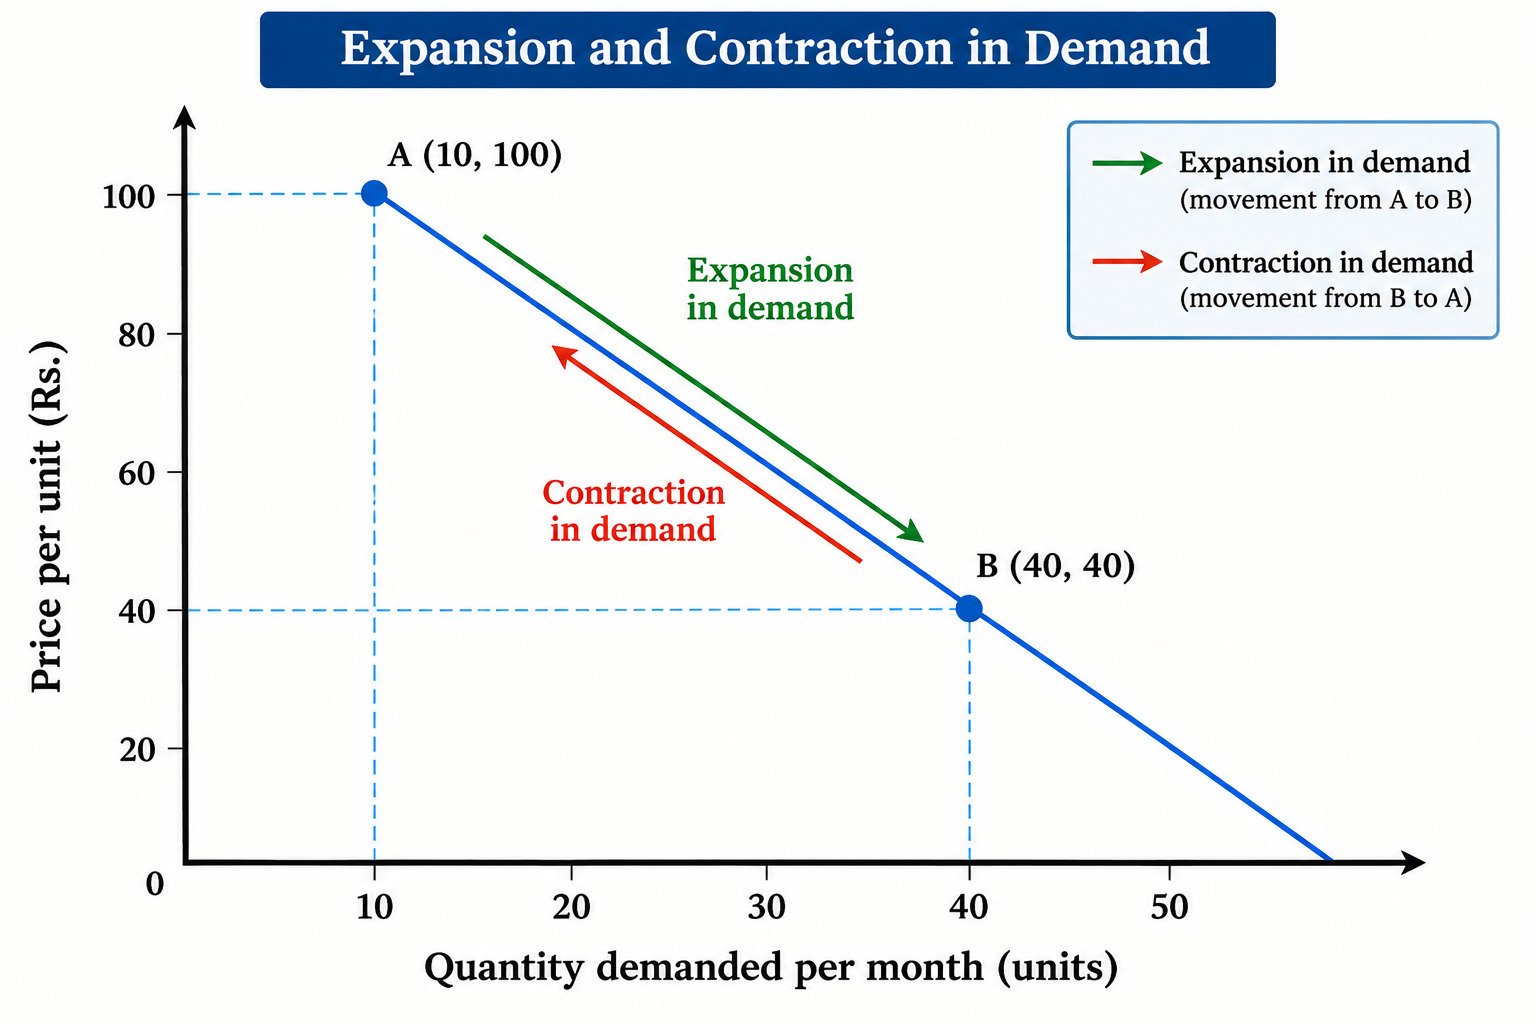
Figure 2: A movement from A to B along the same demand curve due to a change in the good’s own price.
Shift of the demand curve
A shift occurs when a determinant other than the good’s own price changes, causing consumers to demand a different quantity at each given price.
- Increase in demand: The demand curve shifts to the right.
- Decrease in demand: The demand curve shifts to the left.
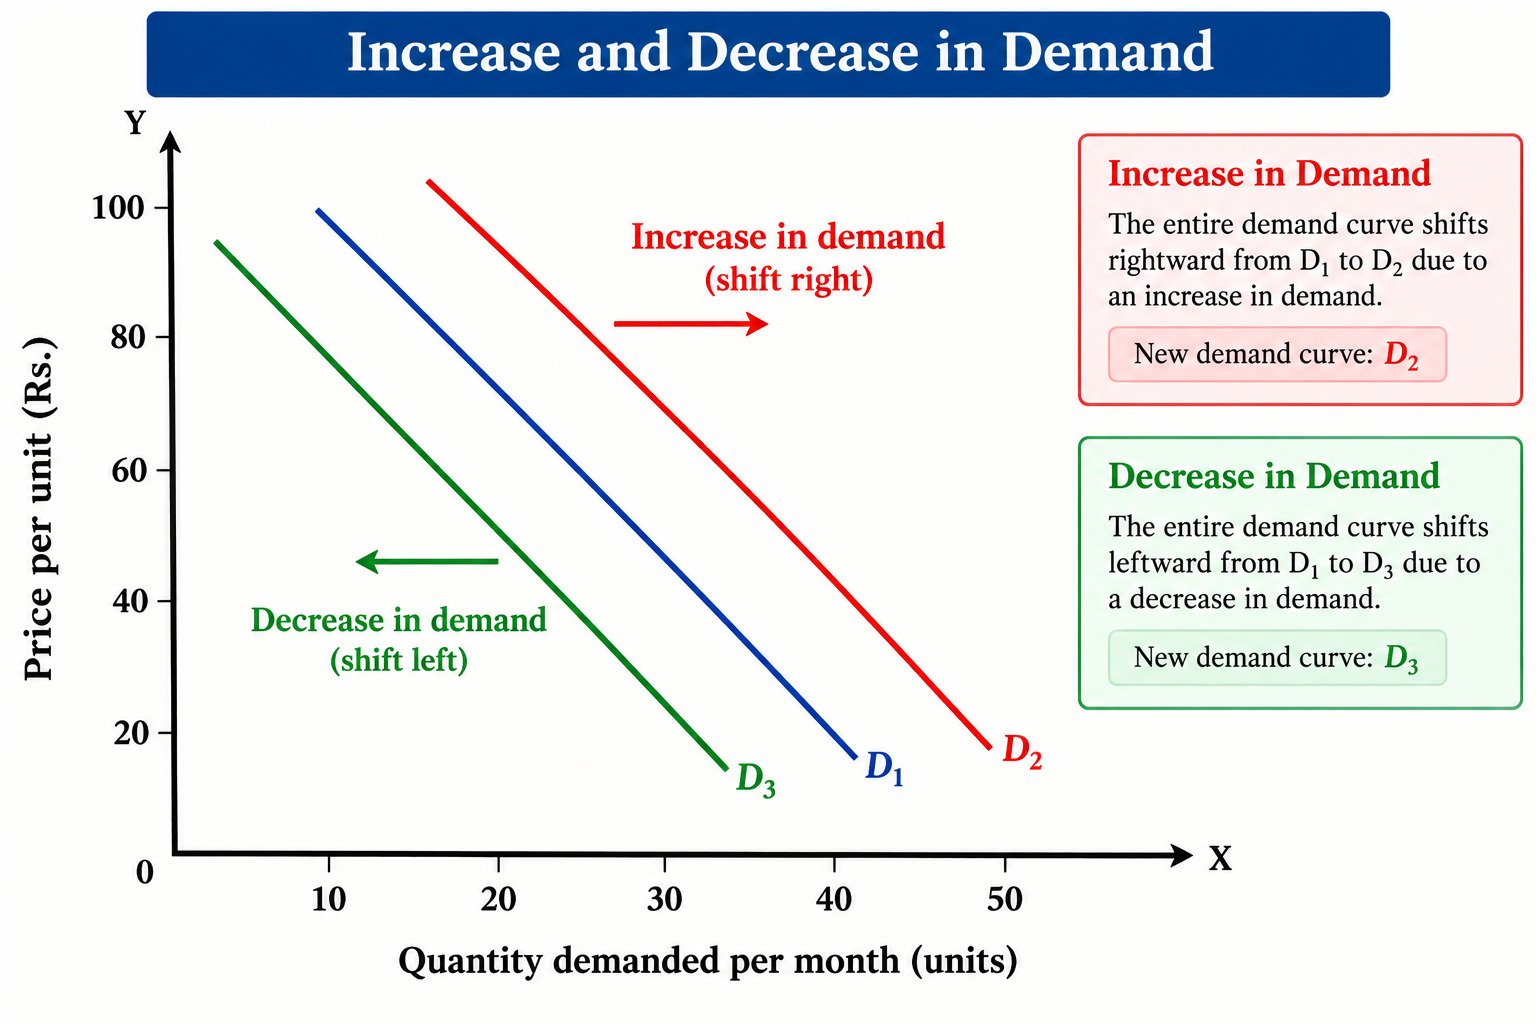
Figure 3: A shift in demand changes the quantity demanded at every given price. The diagram illustrates a rightward shift.
In a rightward shift, consumers demand more at each given price (D2). In a leftward shift, consumers demand less at each given price (D3). The diagrams are conceptual illustrations rather than measured market data.
| Basis | Movement along demand curve | Shift of demand curve |
|---|---|---|
| Cause | Change in the good’s own price | Change in another determinant of demand |
| Effect | Change in quantity demanded | Change in demand |
| Curve | Same demand curve | New demand curve |
| Example | A fall in the price of tea leads to more tea being purchased | An increase in consumer income raises demand for a normal good |
Determinants of Demand
Several factors influence the quantity consumers demand. When factors other than the good’s own price change, they may shift its demand curve.
Price of the good itself
A change in the good’s own price generally causes a movement along its demand curve, not a shift. Under the law of demand, a lower price usually increases quantity demanded, while a higher price usually decreases it, other things remaining constant.
Consumer income
Income affects purchasing power and therefore demand. The direction of the effect depends on the type of good.
- Normal goods: Demand generally increases as consumer income rises. Examples may include restaurant meals, quality clothing, and some household appliances.
- Inferior goods: Demand may decrease as consumer income rises because consumers switch toward preferred alternatives. The classification depends on consumer behaviour and circumstances.
Prices of related goods
Related goods are commonly classified as substitutes or complements.
- Substitute goods: Goods that can replace one another, such as tea and coffee for some consumers. A rise in the price of one may increase demand for the other.
- Complementary goods: Goods used together, such as printers and compatible ink cartridges. A rise in the price of one may reduce demand for the other.
These effects are not identical in every market; they depend on how consumers use and compare the products.
Consumer tastes and preferences
Changes in fashion, habits, advertising, health awareness, or social preferences can increase or decrease demand. For example, greater consumer preference for a particular food may increase its demand even if its price remains unchanged.
Population and number of buyers
An increase in the number of potential buyers generally increases market demand at each price, other things remaining constant. Population growth, migration, and changes in household size may influence the demand for housing, food, transport, and education.
Expectations about future prices
If consumers expect a product’s price to rise in the future, they may purchase more now. If they expect prices to fall, they may postpone purchases. Expectations can therefore affect current demand.
Expectations about future income
Consumers who expect their income to rise may increase current spending on some goods. Conversely, expectations of job loss or reduced income may cause households to limit current purchases.
Distribution of income
Market demand depends not only on total income but also on how income is distributed among households. A change in income distribution may alter demand for different categories of goods because households have different spending patterns.
Season and weather
Seasonal conditions influence demand for products such as heaters, fans, winter clothing, cold drinks, and agricultural inputs. Demand for these goods may vary throughout the year.
Credit availability and interest rates
Access to consumer credit can influence demand for durable goods such as cars, appliances, and housing. Higher borrowing costs may discourage credit-financed purchases, while easier credit conditions may encourage them. The final effect depends on household income, creditworthiness, and expectations.
Government policy and taxes
Taxes, subsidies, regulations, and public policies can affect prices, purchasing power, and consumer choices. For example, a subsidy that reduces the effective price consumers pay may increase purchases. The precise impact depends on how the policy is designed and implemented.
Advertising and information
Advertising, product reviews, and quality information can change consumer awareness and preferences. Successful promotion may increase demand, although the outcome depends on consumer response and competing products.
| Determinant | Possible effect on demand | Illustrative example |
|---|---|---|
| Income | Depends on whether the good is normal or inferior | Higher income may increase demand for quality clothing |
| Price of a substitute | A higher substitute price may increase demand for the good | Tea may become more attractive if coffee becomes more expensive |
| Price of a complement | A higher complementary-good price may reduce demand | More expensive printer ink may reduce demand for some printers |
| Population | More buyers may increase market demand | Population growth may increase housing demand |
| Preferences | Favourable changes may increase demand | Growing preference for a product |
| Future price expectations | Expected price increases may raise current purchases | Consumers buy before an anticipated price rise |
| Season | Demand changes with seasonal conditions | Demand for heaters rises in colder weather |
Exceptions and Limitations of the Law of Demand
The law of demand describes the usual relationship between price and quantity demanded. However, certain circumstances may produce different patterns or make the relationship less straightforward.
Giffen goods
A Giffen good is a special type of inferior good for which a sufficiently strong negative income effect can outweigh the substitution effect. Under specific conditions, a price increase may be associated with an increase in quantity demanded. Such cases are unusual and require particular consumer and market conditions.
Veblen or status goods
Some luxury goods are purchased partly for prestige or status. For certain consumers, a higher price may increase the product’s perceived exclusivity or status appeal. This can complicate the usual price-demand relationship, although it does not mean every luxury good violates the law of demand.
Expectations of future price changes
If consumers believe a price increase signals further increases ahead, they may buy more even as the current price rises. This behaviour involves changing expectations and is not a straightforward example of the law under unchanged conditions.
Necessities and emergencies
Demand for essential medicines or other urgent necessities may respond weakly to price changes. This is often described as price-inelastic demand rather than a genuine violation of the law of demand. A weak response does not necessarily mean quantity demanded rises when price rises.
Important distinction
Before concluding that the law of demand does not hold, economists should examine whether other determinants have changed. A simultaneous change in income, expectations, preferences, or supply conditions may make the observed relationship appear inconsistent with the law.
Importance of Demand Analysis
Demand analysis is useful for consumers, businesses, researchers, and policymakers. It helps explain purchasing decisions and supports decisions about production, prices, and resource allocation.
- Business pricing: Firms use demand estimates to evaluate how consumers may respond to alternative prices.
- Production planning: Businesses use expected demand to plan output, inventories, and capacity.
- Sales forecasting: Demand analysis helps estimate likely sales under different market conditions.
- Government policy: Policymakers consider demand responses when evaluating taxes, subsidies, and price-related policies.
- Consumer behaviour: Economists study demand to understand how income, preferences, and prices influence purchasing choices.
- Market research: Demand analysis helps identify consumer groups, substitutes, and opportunities for new products.
- Resource allocation: Demand information helps producers decide which goods and services to supply.
- Economic research: Demand relationships can be estimated using statistical and econometric techniques.
Worked Economic Examples
Example 1: Calculating quantity demanded
Suppose the demand function for a product is:

Calculate quantity demanded when the price is Rs. 20.
Step 1: Identify the given price.

Step 2: Substitute the price into the demand function.

Step 3: Calculate the result.

Answer: The predicted quantity demanded is 60 units at a price of Rs. 20, assuming the stated demand function applies.
Example 2: Effect of a price decrease
Using the same demand function, suppose the price decreases from Rs. 20 to Rs. 10.
At the initial price:

At the lower price:

The change in quantity demanded is:


Quantity demanded increases by 20 units when the price falls from Rs. 20 to Rs. 10, according to this illustrative demand function. This is a movement along the demand curve.
Example 3: Change in income
Suppose household income rises and consumers purchase more of a normal good at every given price. The demand curve shifts to the right. This is an increase in demand, not merely an increase in quantity demanded caused by the good’s own price falling.
Example 4: Price of a substitute increases
Suppose tea and coffee are substitutes for a group of consumers. If coffee becomes more expensive while other relevant factors remain unchanged, some consumers may switch to tea. The demand curve for tea may shift to the right.
Example 5: Price of a complement increases
Suppose printers and compatible ink cartridges are complementary goods. If cartridge prices rise substantially, some consumers may become less willing to purchase printers. Demand for printers may shift to the left, other things remaining constant.
Summary and Key Terms
- Demand: Quantity consumers are willing and able to purchase at different prices during a given period.
- Desire: Wanting a product without necessarily having the ability or willingness to buy it.
- Demand schedule: A table showing price and quantity demanded.
- Demand curve: A graph showing the relationship between price and quantity demanded.
- Law of demand: Quantity demanded generally rises when price falls and falls when price rises, other things remaining constant.
- Expansion of demand: An increase in quantity demanded due to a fall in the good’s own price.
- Contraction of demand: A decrease in quantity demanded due to a rise in the good’s own price.
- Increase in demand: A rightward shift of the demand curve due to a favourable change in another determinant.
- Decrease in demand: A leftward shift of the demand curve due to a change in another determinant that reduces demand.
- Determinants of demand: Factors such as income, related-good prices, preferences, population, and expectations.
The central lesson is to distinguish between a change in quantity demanded and a change in demand. A change in the good’s own price generally causes movement along the demand curve, whereas a change in another determinant may shift the entire curve.
Frequently Asked Questions
1. What is demand in economics?
Demand is the quantity of a good or service that consumers are willing and able to buy at different prices during a specified period, other things remaining constant.
2. What is the law of demand?
The law of demand states that, other things remaining constant, quantity demanded generally increases when price decreases and decreases when price increases.
3. Why does the demand curve slope downward?
The usual downward slope can be explained by the substitution effect, income effect, diminishing marginal utility, and the entry of additional buyers at lower prices.
4. What is the difference between demand and quantity demanded?
Quantity demanded refers to the amount consumers purchase at a particular price. Demand refers to the entire relationship between price and quantities consumers are willing and able to buy.
5. What causes a movement along the demand curve?
A change in the good’s own price generally causes movement along the existing demand curve, assuming other determinants remain constant.
6. What causes a shift in the demand curve?
Changes in income, preferences, prices of related goods, expectations, population, and other non-price determinants may shift the demand curve.
7. What is the difference between an increase in demand and an increase in quantity demanded?
An increase in demand shifts the curve to the right because a non-price determinant changes. An increase in quantity demanded is a movement along the same curve, usually caused by a fall in the good’s own price.
8. What is a demand function?
A demand function represents quantity demanded as a function of relevant factors, including the good’s price, consumer income, prices of related goods, and preferences.
Practice Questions
Short-answer questions
- Define demand in economics.
- Differentiate between desire and demand.
- What is a demand schedule?
- State the law of demand.
- Explain the meaning of ceteris paribus.
- Differentiate between movement along and a shift of the demand curve.
- Identify four determinants of demand other than the good’s own price.
- Explain the substitution effect and the income effect.
Numerical question
Suppose the demand function for a good is:

- Calculate quantity demanded when price is Rs. 10.
- Calculate quantity demanded when price is Rs. 20.
- Calculate the change in quantity demanded when price falls from Rs. 20 to Rs. 10.
- Explain why this represents movement along the demand curve rather than a shift.
Application question
Suppose consumer income increases and demand for a normal good rises at every price.
- Will the demand curve shift left or right?
- Is this a change in demand or a change in quantity demanded?
- Explain your answer with a suitable economic example.
Continue learning with Minhaj Metrix Hub.
Learn, Analyze and Apply economics through clear explanations, mathematical examples, and practical applications.


 MinhajMetricsHub