
What is Cost Benefit Analysis (CBA)?
Cost Benefit Analysis (CBA) is a process that’s used to determine the profitability of a project by estimating and comparing its costs and benefits measured in monetary terms after adjusting for the time value of money.
Objectives of Cost Benefit Analysis
- To determine the feasibility of a project or program.
- Help in selecting the best project among multiple alternatives.
- Ensure that resources are allocated efficiently.
Some Concepts related to Cost Benefit Analysis
Present Value (PV) is the current value of some future amount of money. The higher the rate of interest smaller the present value of future amount of money.

Future Value (FV) is the value of some present amount of money in the future time period.

Interest (r) is the amount of money which is paid or earned for the use of money. It is the opportunity cost of money. It is used to express TVM.
Time value of money (TVM) is a concept that money today is worth more than the same amount of money in the future due to its earning potential. In CBA costs and benefits are adjusted for time value of money which provides true picture of the costs and benefits of a project.
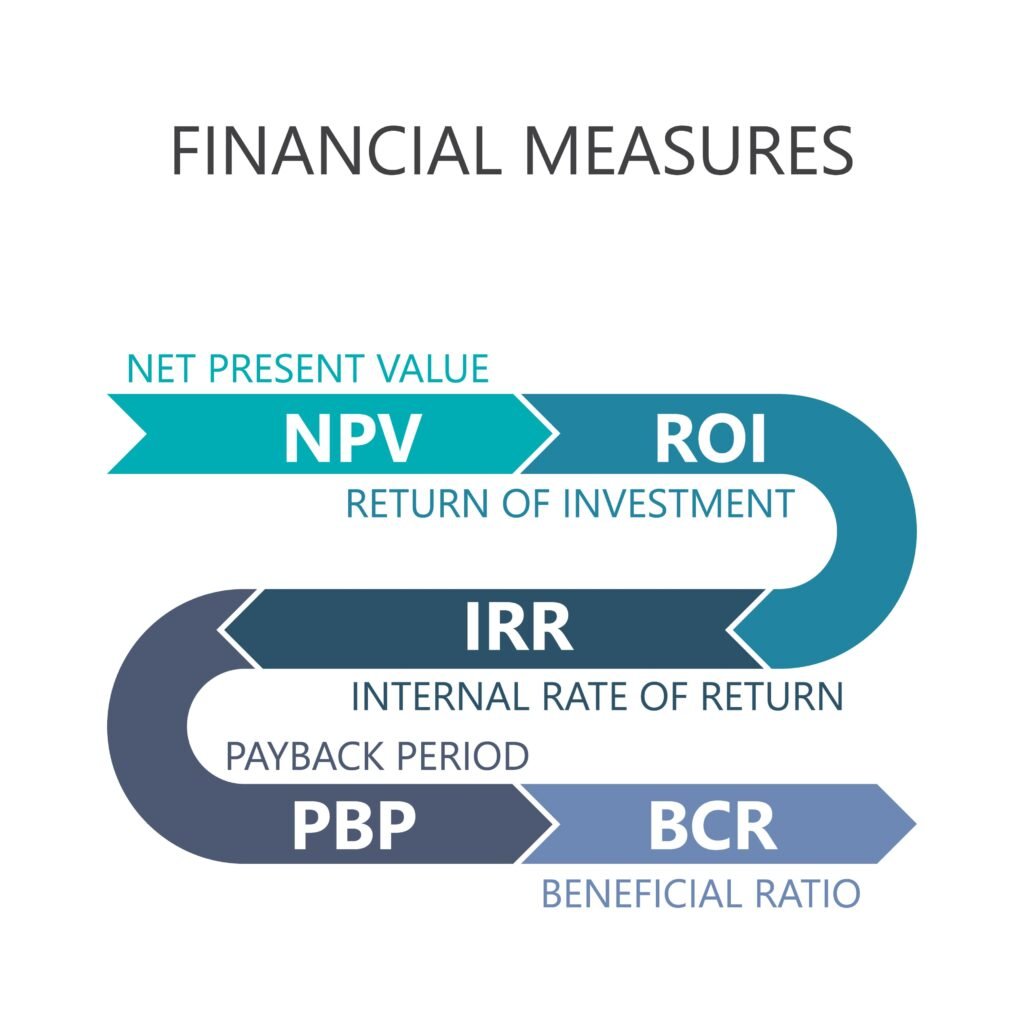
Methods Used in CBA
Net Present Value
Net Present Value (NPV) of a project refers to the difference between the sum of present value of the benefits and the sum of present value of the costs. The NPV method chooses the project with the highest NPV.

- If NPV < 0, the project is not feasible.
- If NPV > 0, the project is profitable.
Benefit Cost Ratio
Benefit-Cost Ratio is the ratio of sum of the present value of benefits to the sum of the present value of the costs. The BCR method chooses the project with the highest benefit-cost ratio.


- If BCR > 1, the project is profitable.
- If BCR < 1, the project is not feasible.
Return On Investment
Return-On-Investment (ROI) is the ratio of net benefits to the total costs of a project. It is expressed as a percentage.

Example:
For example, if the value of total benefits is USD 250,000, total cost is USD 25,000, net benefits are USD 250,000-USD 2500 = USD 225,000, then ROI is given as:

The ROI =900% means that every USD 100 invested or spent in this project generates USD 900 of net benefits.
CBA Example 1
For our cost-benefit analysis example, we’ll think about a residential construction project, the renovation of an apartment complex, the apartment management company concludes that:
The project costs are USD 65,000. They’re paid upfront, so it’s not necessary to calculate their present value The project is expected to generate USD 100,000 in profit for the next 3 years The rate of return based on inflation data is 2%.
Next, we’ll need to calculate the sum of present value of the benefits expected to be earned in the future using the present value formula:

First, we will find NPV which is equal to 
Now we need to find the benefit-cost ratio. Here’s how it would be calculated in this case:
Benefit-Cost Ratio: 288,000/65,000= 4.43 > 1
Since we obtained a NPV > 0 and BCR > 1, we can conclude that the project will be profitable for this company.
CBA Example 2
| Project Alternative 1 | Project Alternative 2 |
| Present value of Costs = USD 80 million | Present value of Costs = USD 9 million |
| Benefits = USD 150 million | Present value of Benefits = USD 20 million |
| NPV = USD 150 million – USD 80m = USD70m | NPV =USD 20 million – USD 9 million = USD 11 million |
| BCR = 150 mn /80 mn = 1.88 | BCR = 20 mn /9 mn = 2.22 |
Since the NPV of project alternative 1 is greater than project alternative 2, therefore firm will choose project alternative 1.
CBA Practice Example 1
A company is considering installing a solar power system for its office to reduce electricity costs. The system is expected to last 3 years, and the company wants to evaluate whether the investment is worthwhile using the Benefit-Cost Ratio (BCR).
| Costs | Benefits |
| Initial Investment (Installation Cost): USD 50,000 | Annual Savings on Electricity Bills: USD 7,000 |
| Annual Maintenance Cost: USD 500 | Government Subsidy (Received in Year 1): USD 5,000 |
| Discount Rate (Required Rate of Return): 8% | Scrap Value (Resale of Panels at End of Year 3): USD 30,000 |
| Project Life: 3 years | |
CBA Practice Example 2
Assume that ABC Inc. is considering two projects, namely Project X and Project Y and wants to calculate the NPV and BCR for each project. Both project X and project Y is four-year project and cash flows of both the projects for four years are given in table 2.
- Using the discount rate of 10% calculate NPV and BCR of both projects.
- Decide on the basis of higher NPV and BCR which project the company should invest in.
| Year | Inflow of Project X in USD | Inflows of Project Y in USD |
| 0 (Initial Investment) | -8000 | -10,000 |
| 1 | 5000 | 1000 |
| 2 | 4000 | 3000 |
| 3 | 3000 | 4000 |
| 4 | 1000 | 6750 |
CBA Practice Example 3
A chairman of a construction company gives a task to his team to make a comparison between 2 potential real estate development projects. He also reminds them that the company’s financial health is getting poor, so he has to select one of them. The team lists the potential income and costs of each project as shown in table 3.
- Calculate the total cost of each project.
- Calculate the total benefits of each project.
- Compute the Benefit-Cost Ratio (BCR) and Net Present Value (NPV) of each project and decide which project should the chairman proceed.
Note: All benefits and costs are in present value so, do not need to discount them.
| Project Parameters | Project 1 | Project 2 |
| Project Duration (Years) | 3 | 2 |
| Total Units to be Constructed | 500 | 400 |
| Units For Sale | 400 | 350 |
| Units For Rent | 100 | 50 |
| Rental Period of Units (Years) | 20 | 15 |
| Units For Sale after Rental Period | 100 | 50 |
| Construction Cost for Each Unit (USD) | 100,000 | 90,000 |
| Sales Office Cost (USD) | 2,000,000 | 3,000,000 |
| Sales Personnel Cost Per Year (USD) | 300,000 | 250,000 |
| Financing Cost Per Year (USD) | 3,000,000 | 2,500,000 |
| Sale Price of Each Unit (USD) | 120,000 | 135,000 |
| Sale Price of Each Unit After Rental Period (USD) | 70,000 | 80,000 |
| Rental Price of Each Unit Per Year (USD) | 4,000 | 4,500 |
Cost-Effectiveness Analysis (CEA)
Cost Effectiveness Analysis (CEA) is a quantitative as well as qualitative analysis to determine the effectiveness of a program or policy in physical units.
It is often used in healthcare, education, environmental policies, and public infrastructure projects where it is easier to quantify benefits in terms rather than monetary terms.
Cost effectiveness analysis can be used in two forms:
- Constant Effects Method
- Constant Cost Method
Constant Effects Method
Constant Effects Method: In this method the objective is to determine which intervention achieves the target outcome at the lowest possible cost. The intervention with the lowest cost is considered the most cost-effective option.
For Example, A government wants to vaccinate 1 million children against a disease. Two programs are considered:
- Program A: Costs USD 5 million
- Program B: Costs USD 4 million
Conclusion: Since both programs achieve the same goal (vaccinating 1 million children), Program B is more cost-effective because it costs less.
Constant Cost Method
Constant Cost Method: In this method the objective is to determine which intervention provides the greatest effectiveness for the given fixed cost.
For example, A hospital has a fixed budget of USD 10 million to reduce infant mortality. It can choose between:
- Program A: Saves 5,000 lives for USD 10 million.
- Program B: Saves 6,000 lives for USD 10 million.
Conclusion: Since both programs have the same cost, Program B is more cost-effective because it saves more lives.
Measuring Coss and Effectiveness
Measuring Costs
Includes direct costs (e.g., materials, labor, training) and indirect costs (e.g., administrative costs, opportunity costs). Costs are typically measured in monetary units (e.g., dollars, rupees).
Measuring Effectiveness
Effectiveness is measured in physical units, such as:
- Healthcare: Number of lives saved, Quality-Adjusted Life Years (QALYs), or Disability-Adjusted Life Years (DALYs).
- Education: Increase in literacy rates, student test score improvements.
- Transportation: Reduction in accidents, travel time saved.
Cost-Effectiveness Measurement
Cost-Effectiveness is measured by three methods:
- Cost-effectiveness ratio (CER)
- Effectiveness-cost ratio (ECR)
- Marginal Cost-effectiveness Ratio
Cost-Effectiveness Ratio (CER)
Cost-effectiveness ratio (CER): It is calculated by dividing costs in monetary terms to effectiveness in physical terms.

Above equation represents the cost per unit of effectiveness. Projects can be rank ordered by CER from lowest to highest. The most cost-effective project has the lowest CER.
Effectiveness-Cost Ratio (ECR)
Effectiveness-cost ratio (ECR): It is calculated by dividing effectiveness in physical terms to costs in monetary terms.

Above equation shows effectiveness per unit of cost (e.g. lives saved per USD spent). Projects should be ranked from highest to lowest ECR.
Marginal Cost-Effectiveness Ratio (MCER)
Marginal CER or Incremental CER is the ratio of difference between the cost of the new and old alternatives, to the difference between the effectiveness of the new and old alternatives.

C1=New cost
C0=Old cost
E1=New effectiveness
E0=Old effectiveness
It measures the additional cost required per extra unit of effectiveness when switching from the old alternative to the new one. A lower MCER means the new alternative is more cost-effective relative to the existing option.
Example: Reducing infant mortality through vaccination programs
A government health department wants to reduce infant mortality by introducing a vaccination program. It has two options:
| Intervention | Cost (Million USD) | Lives Saved | Cost Per Life Saved (USD) |
| Program A: Traditional Vaccination | 50 | 500,000 | 100 USD per life |
| Program B: Mobile Clinics for Remote Areas | 80 | 600,000 | 133 USD per life |
Program A:

Program A:

Program A is more cost-effective because it costs only USD 100 per life saved, whereas Program B costs USD 133 per life saved. Now we will find MCER.

This means that the additional cost per extra life saved by switching to Program B is USD 300 per life.
| Method | What is Constant? | Objective |
| Constant Effects Method | Effectiveness (Output) | Minimize cost |
| Constant Cost Method | Cost (Budget) | Maximize effectiveness |
Limitations of CEA
- CEA excludes external benefits. For example, an improvement in education will not only increase lifetime earnings but also likely to contribute to a reduction in the rates of unemployment and crime.
- CEA excludes external costs.
- It does not incorporate delayed benefits.
- It makes cross-sector comparison difficult.
Difference between CBA & CEA
The difference between CBA and CEA is explained in below table:
| Cost Benefit Analysis | Cost Effectiveness Analysis |
| It is an economic evaluation technique that measures costs and benefits of an intervention in monetary units | It is an economic evaluation technique that measures costs and benefits of an intervention in physical units such as life years saved etc. |
| It is quantitative project evaluation technique. | It is both quantitative and qualitative evaluation technique. |
| It measures costs and benefits on the perspective of whole society | It`s costs and benefits are not measured in monetary units |
| It is used in evaluation of industrial projects. | It is used in service-oriented organizations such health and services. |
Suggestions for further readings:

One Response