
Types of Economic Data
Data is central to any empirical analysis. An empirical analysis uses data to test a hypothesis or theory or to estimate a relationship. The first step in any empirical analysis is to formulate a research question. Model specification is the next step followed by obtaining data. There are many different kinds of economic data sets used in empirical economic analysis. Some econometric techniques can be used across a variety of data sets with minimal adjustments, but certain data sets have unique characteristics that must be carefully considered, sometimes necessitating the development of new econometric methods. Three are mainly four types of datasets. These are:
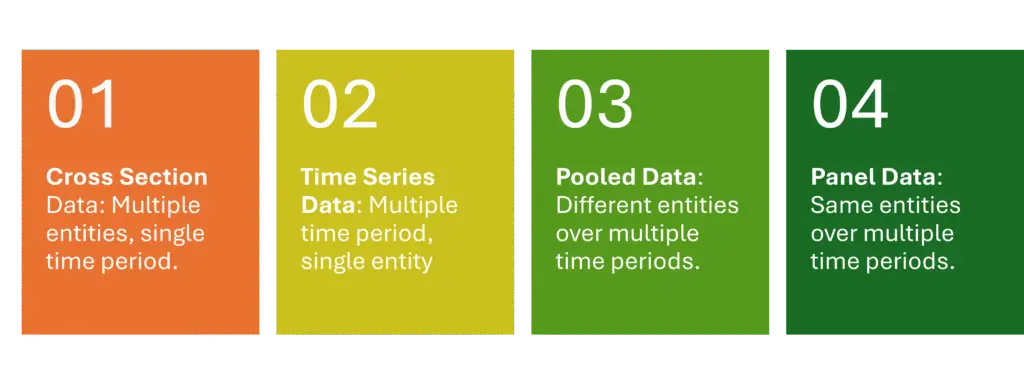
- Cross-Section data
- Time series data
- Pool data
- Panel or longitudinal data
Cross-Section data
Cross-sectional data consists of observations collected from various entities such as individuals, households, firms, cities, states and countries at a given point in time. For example, GDP of Asian countries for the year 2023, number of deaths due to coronavirus pandemic in the year 2020, number of car accidents recorded in different big cities in the year 2023, data on wages, education, experience, gender of 100 individuals of district Khushab.
Sources of cross section dataset in Pakistan are:
- Pakistan Social and Living Standard Measurement (PSLM)
- Household Integrated Economic Survey (HIES)
- Pakistan Demographic Survey (PDS)
- Multiple Indicator Cluster Survey (MICS)
- Labor Force Survey (LFS)
- Population and Housing Census
In econometrics, cross-sectional variables are usually denoted by the subscript i, with i taking values of 1, 2, 3, …, N, for N number of cross-sections. So, if, for example, Y denotes the income data collected for N individuals, will be denoted by: Yi for i = 1, 2, 3, …, N. In economics, the analysis of cross-sectional data is mainly used in microeconomics, labor economics, state and local public finance, business economics, demographic economics and health economics. While dealing with cross section data an important problem that economists must face is heterogeneity.
| Obs. | Wage | Education | Experience | Female |
|---|---|---|---|---|
| 1 | 11.55 | 12 | 20 | 1 |
| 2 | 5 | 9 | 9 | 0 |
| 3 | 12 | 16 | 15 | 0 |
| 4 | 7 | 14 | 38 | 0 |
| 5 | 21.15 | 16 | 19 | 1 |
| … | … | … | … | … |
| 96 | 8 | 1 | 26 | 0 |
| 97 | 12 | 11 | 32 | 0 |
| 98 | 2 | 5 | 14 | 1 |
| 99 | 5 | 9 | 12 | 0 |
| 100 | 7 | 12 | 3 | 0 |
Table 1: Example of Cross-Section Data
Time-Series Data
Time series data consists of observations collected over multiple time periods for a single entity. For example, data about Real GDP (RGDP), Inflation (INF), Unemployment (UR) and Life expectancy (LE) of Pakistan from 1991 to 2019. In this data Pakistan is a single entity observed over multiple time periods from 1991 to 2019, a total of 29 observations. Time series data is often denoted by subscript t, where t shows a specific time observation.
The order of time series data is very important because it is collected in chronological order i.e., in accordance with the occurrence of time. Time series data is collected at various frequences such as daily, weekly, monthly, and annually. An important feature of time series data is that past observations affect the current observations. The original use of time series data is forecasting based on past information. Forecasting requires that the data is stationary, but most time series data is non-stationary. Time series data has four components trend, cyclical, seasonal and irregular components.
| Year | RGDP | Inflation | UR | LE |
|---|---|---|---|---|
| 1991 | 344102.656 | 11.791 | 0.961 | 60.259 |
| 1992 | 370616.781 | 9.509 | 0.961 | 60.116 |
| 1993 | 377133.375 | 9.9737 | 0.969 | 59.934 |
| 1994 | 391228.438 | 12.368 | 0.973 | 60.116 |
| 1995 | 410643.563 | 12.344 | 0.973 | 59.878 |
| … | ||||
| 2015 | 885411.938 | 2.5293 | 6.676 | 65.697 |
| 2016 | 934346.313 | 3.7651 | 5.16 | 65.88 |
| 2017 | 986242.563 | 4.0854 | 6.506 | 66.297 |
| 2018 | 1043742.88 | 5.0781 | 7.849 | 66.482 |
| 2019 | 1078572.63 | 10.578 | 9.574 | 66.756 |
Table 2: Example of Time Series Data
Pooled Data
Pooled data or combined data have features of both cross section and time series data in which each cross-section unit may not be the same for each time period. For example, suppose that two cross-sectional household surveys are taken in Pakistan, one in 1985 and one in 1990. In 1985, a random sample of households is surveyed for variables such as income, savings, family size, and so on. In 1990, a new random sample of households is taken using the same survey questions. To increase our sample size, we can form a pooled cross section by combining the two years.
Panel Data
Panel (or longitudinal) data is a combination of cross-section and time-series data in which data on the same cross-sectional units are collected over multiple time periods. For example, we collect data on GPA, attendance ratio, and study hours for the same BS Economics students across all semesters. Similarly, data about GDP, inflation, unemployment rate, money supply, and investment for all developing countries from 1970 to 2023. For panel data, the subscripts i and t are used. The subscript i is used for cross-sectional and t is used for time-series data. Examples of panel datasets:
- World Development Indicators (WDI)
- Penn World Table (PWT)
- World Economic Outlook (WEO)
- International Financial Statistics (IFS)
- World Values Survey (WVS) etc.
In balanced panel number of time observations are same for all cross-section units. In unbalanced panel number of time observations are not same for all cross-sectional units. For example, if GPA and attendance data are available for all BS Economics students for every semester, with no missing observations, the panel is balanced. If some students drop after some semester, then we do not have complete data for all students in all semesters, this is unbalanced panel.
| Name | Panel ID | Year | GDPG | FDI | P |
|---|---|---|---|---|---|
| Pakistan | 1 | 2016 | 5.526736 | 0.924442 | 2.086326 |
| Pakistan | 1 | 2017 | 5.554277 | 0.819523 | 2.077578 |
| Pakistan | 1 | 2018 | 5.836417 | 0.552187 | 2.057546 |
| Pakistan | 1 | 2019 | 0.988829 | 0.802956 | 2.022967 |
| Pakistan | 1 | 2020 | 0.525527 | 1.053726 | 1.97832 |
| India | 2 | 2016 | 8.256306 | 1.937363 | 1.090459 |
| India | 2 | 2017 | 6.795383 | 1.507317 | 1.063359 |
| India | 2 | 2018 | 6.532989 | 1.559264 | 1.037828 |
| India | 2 | 2019 | 4.041554 | 1.763128 | 1.013261 |
| India | 2 | 2020 | -7.96461 | 1.966992 | 0.989414 |
| Srilanka | 3 | 2016 | 4.486635 | 1.088638 | 1.104984 |
| Srilanka | 3 | 2017 | 3.57817 | 1.57023 | 1.13022 |
| Srilanka | 3 | 2018 | 3.272 | 1.835095 | 1.048393 |
| Srilanka | 3 | 2019 | 2.255177 | 0.885336 | 0.611876 |
| Srilanka | 3 | 2020 | -3.56908 | -0.06442 | 0.530627 |
Table 3: Example of Balanced Panel Dataset
| Name | Panel ID | Year | GDPG | FDI | P |
|---|---|---|---|---|---|
| Pakistan | 1 | 2016 | 5.526736 | 0.924442 | 2.086326 |
| Pakistan | 1 | 2017 | 5.554277 | 0.819523 | 2.077578 |
| Pakistan | 1 | 2018 | 5.836417 | 0.552187 | 2.057546 |
| Pakistan | 1 | 2019 | 0.988829 | 0.802956 | 2.022967 |
| Pakistan | 1 | 2020 | 0.525527 | 1.053726 | 1.97832 |
| India | 2 | 2016 | 8.256306 | 1.937363 | 1.090459 |
| India | 2 | 2017 | 6.795383 | 1.507317 | 1.063359 |
| India | 2 | 2018 | 6.532989 | 1.559264 | 1.037828 |
| India | 2 | 2019 | 4.041554 | 1.763128 | 1.013261 |
| Srilanka | 3 | 2016 | 4.486635 | 1.088638 | 1.104984 |
| Srilanka | 3 | 2017 | 3.57817 | 1.57023 | 1.13022 |
| Srilanka | 3 | 2018 | 3.272 | 1.835095 | 1.048393 |
Table 4: Example of Unbalanced Panel Dataset
Other Types of Data
Experimental vs Non-Experimental Data
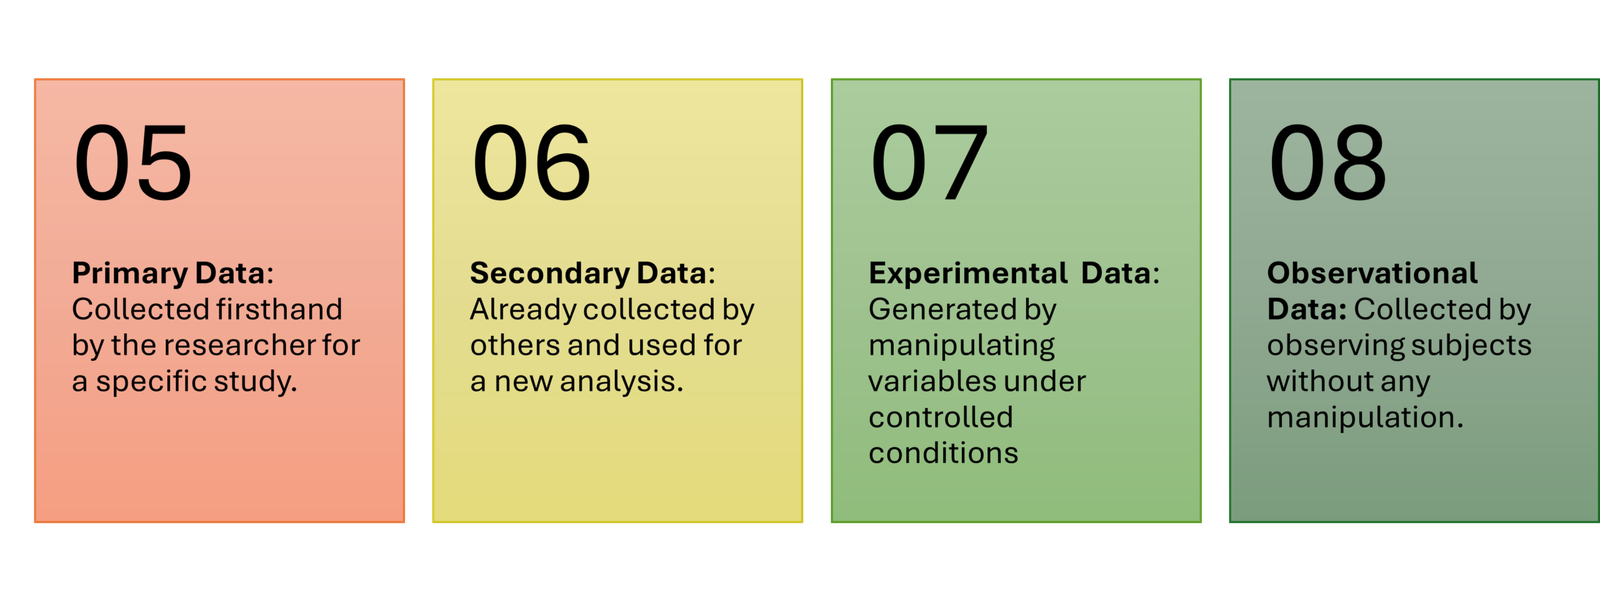
Experimental data is collected through controlled experiments where researchers can manipulate one or more independent variables to observe their effects on dependent variable by controlling the effects of other variables. This method is often used to establish cause-and-effect relationships.
Examples:
- Testing the effectiveness of a new vaccine
- Analyzing the effect of fertilizer on plant growth
Non-Experimental data or observational data is collected by observing and recording events, behaviors, or phenomena as they naturally occur without manipulation. This method is used where experiments are not possible, not ethical or expensive.
Sources of Data Collection
Primary data is the data collected for the first time by a researcher for his/her specific research purpose. This data has not been published yet and is more reliable. Primary data is collected through surveys, interviews, experiments, observations, and questionnaires. Since the researcher himself collects the data from the (sample) respondents, he gets the precise data actually needed for the research project.
For example, a researcher wants to study the effect of online learning on students’ academic performance. He designs a questionnaire and personally surveys 150 university students, asking about their study hours, internet usage, GPA, and learning experience. The information he collects directly from these students is primary data.
Secondary data is data that has already been collected by an institution or researcher for different purposes. it can be obtained from sources such as books, reports, articles, online databases and surveys. The researcher need not to prepare schedule or questionnaire for the collection of data from the sample respondents. Therefore, collecting secondary data is often less expensive and less time consuming to obtain and analyze. For example, a researcher studying CO₂ emissions and economic growth uses data published by the World Bank and Our World in Data. Since the data were collected earlier by these organizations for their own purposes, they are secondary data.
When to use Secondary Data
Though secondary data can be less valid compared to primary data, still it is preferred in the following cases:
- It is difficult to obtain primary data and easier to get secondary data.
- When primary data does not exist and hence, the researcher has to depend only on secondary data.
- When primary data is present, but the respondents are not willing to reveal the information.
- When the budget is too limited
- When there is a time constraint on the part of the researcher to collect primary data.
Answer the following questions
- Define cross section data with example.
- Define time series data with example.
- Define panel data with example.
- Differentiate pool and panel data.
- What is observational data? Give example.
- What is experimental data? Give example.
- Define primary data with example.
- Define secondary data with example.

2 Responses