

Introduction to Microeconomic Household Fertility Theory
The 3rd stage of Demographic Transition Theory marks the decline of birth rate with the increase in level of economic development. To explain this decline in birth rate we use Microeconomic Household Fertility Theory which is the application of consumer behavior in microeconomics.
Microeconomic Household Fertility Theory states that a household behaves like an individual consumer, and children are treated as normal good. The household derives satisfaction from having children as well as from consuming other goods and services. Therefore, household tries to maximize its satisfaction by making choices between the number of children and other consumer goods. Therefore, the utility function can be written as:


Children Demand Function
According to this theory desire or demand for children ( ) depends on household income
  , net price of the children
  , prices of other goods relative to children
  , and taste for goods relative to children
  .
.

is the demand for surviving children
is the level of household income
is the “net” price of children P
is price of all other goods
is the tastes for goods relative to children
Expected Relationships
- Desire for children is positively related to household income. The higher the income, the greater the demand for children.

- Desire for children is inversely related to the net price of the children.


- Demand for children is positively related with the price of other goods. The higher the price of other goods, the higher the demand for children (due to substitution effect).
 .
. - Desire for children is negatively related with the taste of goods relative to children, the greater the strength of tastes of relative goods, the lower the demand for children. .
 .
. .
.Indifference Curve & Budget Line
Households desire for children is expressed in terms of an indifference curve (IC), Each IC is the locus of commodity-child combinations that provide same level of satisfaction, and higher the IC higher will be the satisfaction. The Children utility function can be written as:
- = Consumption of children
= Consumption of other goods
The budget constraint shows commodity-child combinations which the household can afford given the price of children and income of the household.

- = Income
= Price (cost) of children
= Consumption of children
= Price of other goods
= Quantity of other goods
The slope of budget line is the price of children relative to price of goods. The steeper the budget line, the higher the price of children relative to goods.

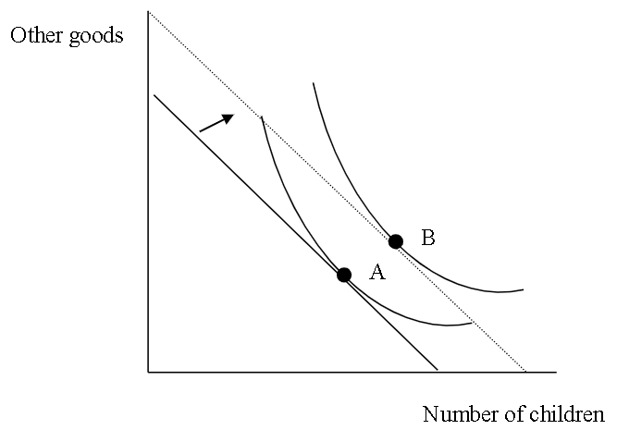
Effect of Rise in Income of household
An increase in households’ income holding price of children and price of other goods constant leads to parallel shift of budget line allowing to more consumption of both commodities, household move to higher utility level from point A to B.
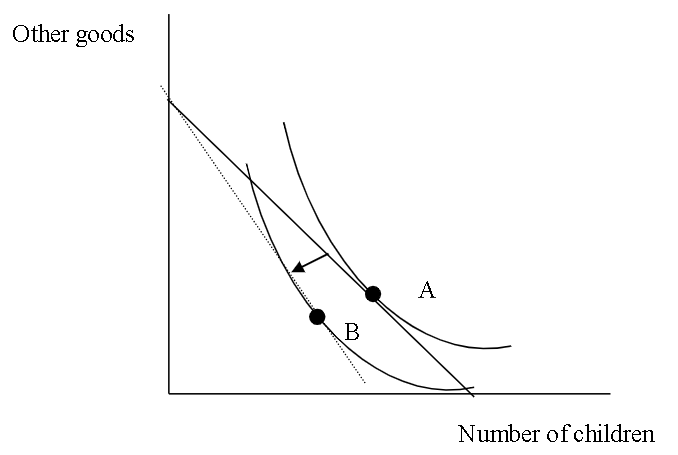
Rise in Price of Children
An increase in price of children i.e. increase in women opportunity cost (holding income and price of other goods constant) lowers demand for children, budget line rotates inward from X-axis and becomes steeper, and consumer moves to lower utility level from point A to B.
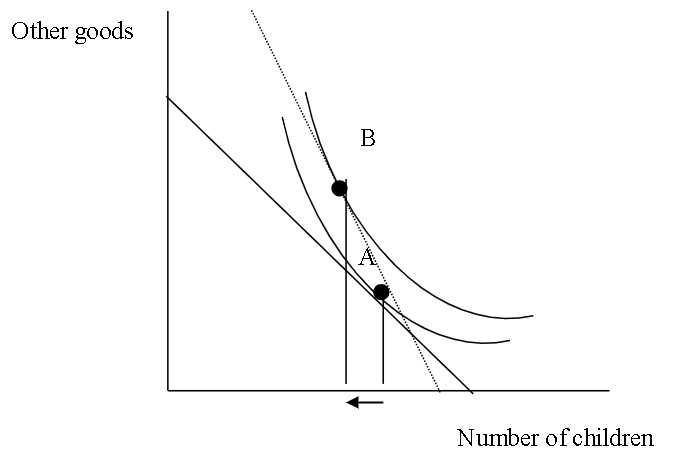
Rise in Income as well as Price of Children
An increase in income as well as price of children rotates as well as shift the budget line which lowers demand for children and increases demand for other goods.
Explanation through Diagram
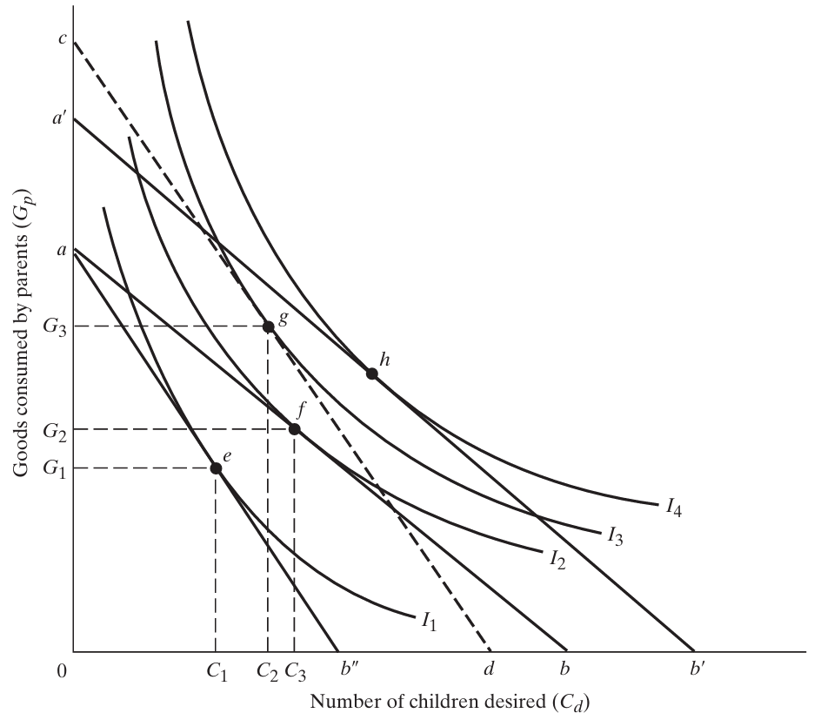
Figure 1: Microeconomic Household Fertility Theory
Explanation
- The horizontal axis shows number of children desired, and vertical axis shows desire for other goods.
- The household chooses that combination of goods and children that maximizes family satisfaction.
- This optimal combination is represented by point f, where budget constraint ab is tangent to the indifference curve I2 Therefore, C3 children and G2 goods will be demanded.
- A rise in family income causes parallel outward shift of budget line from ab to a`b` and indifference curve from I2 to I4. leading to more consumption of both commodities.
- An increase in price of children as a result of, say, expanding female employment opportunities, a rise in wages, tax on children beyond a certain number per family, lowers demand for children, budget line becomes steeper, and consumer moves to lower indifference curve. BL rotates from ab to ab“.
- Finally, that if there is a simultaneous increase in household income and net child price there will be both an outward shift and downward rotation of the budget constraint line to, say, dashed line cd.
- The result is a new utility-maximizing combination that includes fewer children per family (point g compared with point f). In other words, higher levels of living for low-income families in combination with a relative increase in the price of children will motivate households to have fewer children.
Conclusion
Besides, it may be noted that as income of the family increases the parents may like to spend more on each child for providing them better education and keeping then well-nourished and healthy and this would also cause the parents to prefer to have a fewer child.
The conclusions of economic theory of fertility explained above are in conformity with the theory of demographic transition according to which in the third stage of demographic transition birth rate falls coupled with already falling death rate brings down the rate of growth of population.
From the economic theory of fertility as applied to developing countries, Todaro and Smith reach the following conclusions “When the price or cost of children rises as a result of, say increased educational and employment opportunities for women or a rise in school fees or the establishment of minimum-age child labour laws parents will demand fewer additional children”.
Suggestions for further reading:


 MinhajMetricsHub
One Response
yay google is my world beater helped me to find this outstanding site! .