
In the previous lecture we discuss the types and nature of economic data used in any empirical economic analysis. To read click on Types of Economic Data. We also discuss the sources of obtaining economic data. In this post will discuss about the nature of regression analysis, its objectives, uses in economics. We will also see how economic and econometric model differs and what is stochastic error term. Further, we differentiate regression and correlation, regression and causation.
Origin of Regression Analysis
Regression analysis is one of the commonly used tools in econometrics. But what is regression analysis? The dictionary meaning of regression is “backward movement”, or “return to an earlier stage of development”. In fact, regression analysis as it is currently used has nothing to do with regression as dictionaries define the term. The term regression was coined by Frnacis Galton from England who was studying the relationship between heigh of children and the height of parents. He found that although tall parents had tall children and short parents had short children, there was a tendency for children`s height toward the average. Galton termed this a “regression toward mediocrity”.
Modern Interpretation of Regression Analysis
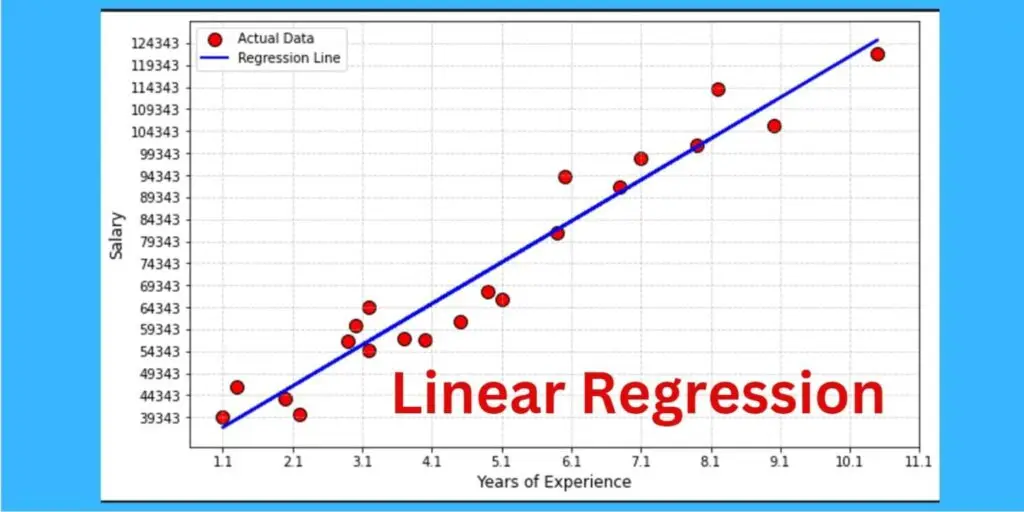
Regression analysis is used to estimate or predict the values of one variable known as dependent variable (Y) on basis of one or more other variables known as explanatory variables (X).
According to Gujarati, regression analysis is concerned with the study of the dependence of one variable, the dependent variable, on one or more other variables, the explanatory variables. The purpose of regression analysis is to estimate and predict the population mean value of the dependent variable on the basis of known or fixed values of the independent variable. In other words, finding the expected value of the dependent variable E(Y) conditional on the given values of independent variables. That is E (Y | X).
From above definition it must be clear that regression is the study of dependence. It shows how one variable is influenced by one or more predictors. Regression analysis does not claim to predict Y exactly on the basis of X(s) because there are certain unobserved factors that might affect Y but not taken into account explicitly in regression model. Therefore, there is always a deviation between estimated regression line and actual observed values of Y. The deviation of actual values from estimated regression line is called residual. It is this residual that we try to minimize in ordinary least squares (OLS).
Objectives of Regression Analysis
Regression analysis has four main objectives. These are:
- To quantify how one factor causally affects another. For example, if a person obtains one additional year of schooling, how much would we expect that person’s income to increase after controlling pther factors?
- To forecast or predict an outcome. For example, policymakers may want to forecast inflation rate next year. They include various factors in regression model that help forecast inflation.
- To determine the predictors of some factor. For example, parents or school counselors may want to know what factors could predict whether a teenager is using drugs.
- To adjust an outcome for various factors. For example, rather than just evaluating a teacher’s effectiveness based on his/her students’ test scores, we could adjust those scores based on the students’ prior scores and perhaps the demographics and English-language status of the students.
These four objectives are summarized in table 1.
| Regression Objective | Generic Types of Questions Addressed |
|---|---|
| Estimating causal effects | How does a certain factor affect the outcome? |
| Determining how well certain factors predict the outcome | Does a certain factor predict the outcome? What factors predict the outcome? |
| Forecasting an outcome | What is the best prediction/forecast of the outcome? |
| Adjusting outcomes for various (non-performance) factors | How well did a subject perform relative to what we would expect given certain factors? |
Table 1: Four main objectives of regression analysis
Economic vs Econometric Model
Economic model
A model is a simplified representation of a real-world process. The term simplified means easy to understand, communicate, test, and validate. (G.S. Maddala)
An economic model is a set of assumptions that describes the behavior of an economy. It consists of mathematical equations that describe various relationships. Some economic models are circular flow model, business cycle model, demand-supply model etc.
Econometric model
An econometric model is:
- A set of behavioral equations derived from the economic model. These equations involve some observed variables and some unobserved variables.
- A statement of whether there are errors of observation in the observed variables.
- A specification of probability distribution of the disturbances. (G.S. Maddala)
Behavioral relationships describe how a particular variable behaves in response to changes in other variables.
Example of a Linear econometric model
Components of an econometric model?
Every econometric model has two parts: firstly, an observed, deterministic, systematic, and predictable component and, secondly, an unobserved, stochastic, or unpredictable component often called random error term, or disturbance term, or noise. It is denoted by epsilon ε. In an econometric model we must realize that economic relationships are not exact, this is because economic theory does not claim to be able to predict the specific behavior of any individual or firm but rather describes the average or systematic behavior of many individuals or firms. The systematic portion comes from economic theory. After specifying the systematic and unsystematic portion we must know the algebraic relationship among our economic variables whether it is linear, logarithmic, or exponential etc.
What is a stochastic error term (ε)
The error term is included in regression equation to capture the influence of all other variables that affect Y but are not explicitly included in the model. It is denuded by epsilon ε. I
t is, in effect, a symbol of the econometrician’s ignorance or inability to model all the movements of the dependent variable This variation probably comes from sources such as omitted influences, measurement error, incorrect functional form, or purely random and totally unpredictable occurrences. By random variation we mean something that has its value determined entirely by chance.
Linear Regression Model
The linear regression model shows the linear dependence of one variable on one or more independent variables. A simple linear regression model consists of linear dependence of one variable on only one independent variable. It is also called bivariate or two variable regression model. Such as dependence of consumption on disposable income. A multiple linear regression model consists of linear dependence of one variable on two or more independent variables. It is also called multivariate regression model. For example, crop yield depends on rainfall, temperature, sunshine, fertilizer etc.
There are many different terminologies and notations are used for dependent and independent variable(s) in the literature. These are:
| Dependent Variable | Independent Variable |
|---|---|
| Explained Variable | Explanatory Variable |
| Predictand | Predictor |
| Regressand | Regressor |
| Response | Stimulus |
| Endogenous | Exogenous |
| Outcome | Covariate |
| Controlled Variable | Control Variable |
Table 2: Notation and terminology
Components of linear regression model
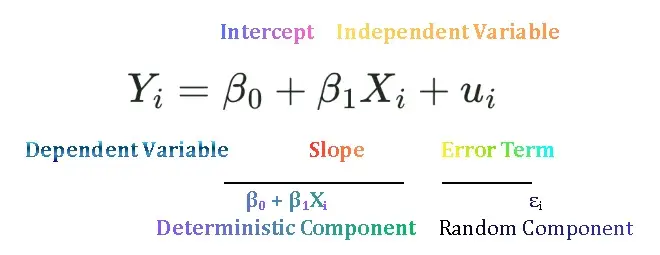
A linear regression model in general terms can be written as:
Yi = β0 + β1 Xi + ui
A linear regression model consists of five main components:
- Dependent Variable (Y): The dependent variable is the variable that you are trying to explain or predict. Its value depends on the values of other variables. It is also called the outcome variable, response variable, or explained variable.
Example: In a crop yield regression, crop yield is the dependent variable. - Independent Variable (X): The independent variable explains the variations in the dependent variable. It is also known as the explanatory variable, regressor, treatment variable, or X-variable.
Example: In the regression of consumption on income, income is the explanatory variable. - Slope Coefficient (β1): The coefficient on the explanatory variable represents the slope of the regression line. It measures the unit effect of X on Y.
Example: If β1 = 0.6, then a one-unit increase in income is associated with a 0.6 unit increase in consumption. - Intercept Term (β0): The intercept represents the expected value of Y when X = 0. It is also called the constant term.
- Error Term (ui): The error term shows the difference between the actual observed value and the predicted value of Y. It captures the effect of unobserved factors that influence Y but are not explicitly included in the model.
The Use of Regression Analysis in Economics
Regression is an important toolkit for econometricians to estimate the relationship between economic variables. For example.
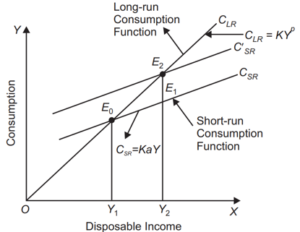
- A macroeconomist may be interested in studying the dependence of personal consumption expenditure on after tax or disposable real personal income. It gives us the value of MPC.
- A development economist might want to explore whether people living in wealthier countries generally have fewer children than those living in poorer countries.
- A monopolist who can fix the price or output (but not both) may want to find out the response to the demand for a change in price. It gives us price elasticity of demand.
- A labor economist may want to study the impact of rate of change of money wages on the unemployment rate.
- To examine the relationship between the amount of money, as a proportion of their income, that people would want to hold at various rates of inflation. (Money demand function)
- The marketing director is interested in estimating the elasticity of demand w.r.t advertising expenditure.
- Finally, an agronomist may be interested in studying the dependence of a particular crop yield, say, of wheat, on temperature, rainfall, amount of sunshine, and fertilizer.
Deterministic vs stochastic relationships.
Deterministic relationships between variables imply exact relationships. It does not include any randomness. If we plot graphs of these relationships, then all data points will lie exactly on the line. Mathematical/economic models are example of deterministic relationships.
Yi = β0 + β1 Xi
Stochastic relationships between variables imply inexact or random relationships. If we plot graphs of these models some data points lie above the line, on the line, or below the line. Econometric models are examples of stochastic relationships.
Yi = β0 + β1 Xi + ui
Conditional and unconditional mean
| Conditional Mean | Unconditional Mean |
|---|---|
| It is the expected value of Y given the fixed values of X. | It is the expected value of Y, but this is not based on the X values. |
| X variable is included | X variable is disregarded |
| E (Y | X) | E (Y) |
| Example: What is the average weekly consumption of a family having a particular income level. | Example: What is the average weekly consumption of a family. |
Table 3: Difference between conditional and unconditional mean
Correlation vs Regression
Correlation
Correlation is a statistical technique which measures the direction and strength of linear relationship between variables. It tells us whether two variables move together in the same direction, move in opposite direction or they are not related. It is measured by correlation coefficient which ranges from -1 to +1. The sign (+, -) of the correlation coefficient indicates the direction of the association. The magnitude of the correlation coefficient indicates the strength of the association.
- +1 is perfect positive correlation
- -1 means perfect negative correlation and
- 0 means no correlation
For example, relationship between econometrics scores and maths score, relationship between GDP per capita and life expectancy in developing countries. The correlation coefficient is symmetric; it means that if we swap the variables the value of correlation coefficient will not be changes. Thus, correlation between X and Y is same as correlation between Y and X. There is no distinction between dependent and independent variable. It is because correlation does not measure cause and effect relationship, it is just a measure of how two variables move together. So, it does not fit best line on data points.
Regression
Regression is a statistical technique which is used to predict the values of one variable based on the values of other variable(s). For examples, we want to predict the consumption level of the family whose weekly income is 80 USD. Or we want to predict the crop yield of a farmer based on the given or known values of fertilizer, rainfall, temperature, sunlight, soil quality etc. Similarly, we want to predict semester G PA of a student based on how many classes he/she attended, how may hours he/she studied etc. Thus, regression goes beyond the correlation by estimating the predictive relationships between variables.
In regression analysis we distinguish between dependent and independent variable. The best fit line when we regress Y on X is not the same as the best fit line when we regress X on Y. The choice of dependent and independent variables is based on underlying economic theory. This step of identifying variables is made when we build economic/mathematical model.
To view the difference, click on Regression vs Correlation Table
| Regression Analysis | Correlation Analysis |
|---|---|
| The purpose of regression analysis is to estimate or predict the average value of dependent variable on the given values of independent variables. | The purpose of correlation analysis is to measure the direction and strength of linear association between two variables. |
| There is an asymmetry i.e. there is a distinction between the dependent and independent variables. | We treat any (two) variables symmetrically i.e. no distinction between the dependent and independent variables. |
| Y is random, X has given or fixed values. | Both variables are assumed to be random. |
| It provides us both slope coefficient and intercept. | It provides us only correlation coefficient. |
| Units depend on variables. | It is unitless. |
Regression vs Causation
Regression analysis is concerned with the dependence of one variable on other variable(s), it does not necessarily imply causation (estimating cause and effect relationship). In the words of Kendall and Stuart, “A statistical relationship, however strong can never establish causal connection: causation must come from outside statistics, ultimately from some theory or other”. For example, if crop yield depends on rainfall, then there is no statistical reason to assume that crop yield does not affect rainfall, obviously common sense implies that the reverse cannot happen
Answer the following question
- Define regression analysis.
- Write four main objectives of regression.
- What is the use of regression in economics?
- What is an econometric model?
- Differentiate regression and correlation
- Differentiate regression and causation
- Define simple linear regression with example and equation.
- Define multiple linear regression with example and equation.
- Differentiate deterministic and stochastic relationships with examples.
- Differentiate conditional and unconditional mean.
- Define dependent and independent variable with example.
Suggestions for Further Readings


 MinhajMetricsHub
2 Responses