
LQ 1; Define development economics. What is the scope/significance of development economics.
What is Development Economics?
Development economics is the subfield of economics which studies how economies are transformed from stagnation to growth and from low income to high income status and overcome the problem of extreme poverty.
Why a separate discipline?
Traditional vs Development Economics
Traditional economics (classical and neoclassical) mainly dealt with models applied in developed economies which assumed full employment, perfect competition, and well-functioning market. However, developing countries face unique problems like poverty, high unemployment, low productivity, poor health and education, inequality, and weak institutions. These require new theories and policies which is the subject matter of development economics.
Scope of Development Economics
Scope of development economics refers to the areas, issues and theories discussed in it. These are:
- Theories of Economic Growth and Development: It studies how economies grow over time and move from stagnation to growth, from low income to high income and transform from agrarian to industrialized economy. These include linear stage models, structural change models, dependency models, exogenous and endogenous growth theories.
- Theories of population: Study the effects of population growth, migration, labor markets, and unemployment on development. Major theories of population are demographic transition, Malthusian theory, Microeconomic household fertility theory, Optimum population theory etc.
- Poverty and Inequality: It analyses causes, consequences, measurements and strategies to combat poverty and inequality. Gini coefficient and Lorenz curve are commonly used measures of inequality.
- Sustainable Development and Environment: Addressing the balance between economic growth and environmental preservation, including the impact of disasters, epidemics, climate change, global warming, green finance and carbon emissions on sustainable development.
- International trade and finance: It assesses the effects of globalization, trade policies, foreign aid, and foreign direct investment on developing economies.
- Human Capital Formation: It focuses on the role of education, skills, and health in economic development.
- Institutions and Governance: Investigating how political, legal, and social institutions impact development outcomes and policy effectiveness.
- Agriculture and Industries: Analyzing the role of agriculture development, food security, green revolution on industrial and economic development.
- Policy Evaluation: Designing and implementing various growth strategies, evaluating development policies and projects.
Link with other fields
Development economics is a broad field which incorporates research in political economy, institutional, behavioral and experimental economics; it overlaps and links with other subfields including labor, public, urban, agricultural, environmental, population, health, education, and international economics. And it draws extensively from other social science disciplines including history, political science, psychology, and sociology.
LQ 2; What is economic development? How do we measure economic development of a country?
Economic development
Economic development can be defined as the process where increase in per capita income or output also leads to improvements in living standard of whole population, reductions in poverty, unemployment and inequality, increased access of goods and services that satisfy basic needs and increased employment opportunities and choices.
Measurement of Economic development
There are two approaches to measure economic development:
- Traditional Approach
- Modern Approach
Traditional Approaches:
1. Real Gross National Product (GNP)
Real Gross National Product refers to the total output of final goods and services produced by residents of a nation in a year in real terms. According to Meier and Baldwin, “Economic Development occurs when an economy’s real national income increases over a long period of time.”
Shortcomings
- Does not consider the growth of population.
- Does not consider environmental degradation.
- Difficulties in measurement of GNP.
- Tells nothing about the distribution of income in the economy.
- Does not consider methods of production and nature of goods.
- GNP has not been successful in raising living standards and reducing poverty.
2. Real Gross National Product Per Capita
This method measures economic development in terms of an increase in GNP per capita which refers to the total output of final goods and services divided by total population. It is a measure of the average living standard of a country. But this method has the same limitations as GNP method. But it is most commonly used method to compare economic development among countries.
3. Economic Welfare Criterion or Consumption per capita
According to this criterion economic development occurs when there is an increase in the consumption of goods and services of individuals. According to Okun and Richardson, economic development is “a sustained, long-term improvement in material well-being”.
Modern Approaches:
4. Basic Needs or Social Indicators Approach
Some economists measure economic development in terms of social indicators. Social indicators are often referred to as the basic needs for development. Some social indicators include literacy rate, life expectancy, healthcare, calories intake, infant mortality and others. This approach focusses on alleviation of poverty.
5. Human Development Index
The UNDP developed human development index in 1990 to measure socio-economic development of a country. It has three dimensions: Long and healthy life, Knowledge, and living standard. It ranges from 0 to 1.
6. Physical Quality of Life Index
It was invented by M.D. Morris in 1979. He constructed a composite index by combining three indicators of infant mortality, life expectancy at age one and basic literacy at age 15. Economic progress occurs if life expectancy (LE) increases, infant mortality rate (IMR) falls and basic literacy rate (BLR) increases.
7. Urbanization Rate
Urbanization is the percentage of a country’s population who live in urban areas. Generally, as countries develop urbanization increases.
8. Occupational Structure
As countries develop the occupational structure of the labor force changes. In LDCs most people are engaged in primary activities such as agriculture, mining, fishing. In high income countries like the United States most people are involved with the tertiary sector such as retailing, transportation, banking, education etc.
LQ 3 What are LDCs? Write down the characteristics of least developed countries (LDCs).
Least Developed Countries (LDCs)
A country that has three characteristics are named as least developed countries: low income, low human capital (health and education), and high economic vulnerability.
Characteristics of Least Developed Countries (LDCs)
1. Low Level of Income and Productivity
There is a large productivity difference between advanced economies such as the United States and the developing nations. It is due to the large gaps in output per worker. Developing countries often face a vicious circle of poverty due to lack of productivity, income and capital.
2. Low Level of Human Capital
The least developed countries have lower levels of nutrition, health, and education. According to UNDP human development report 2023-24 HDI of LDCs is 0.542 and most developed countries have HDI value 0.8 or above.
3. High Level of Inequality and Poverty
Very high levels of inequality and absolute poverty are found in many low-and-middle income countries due to low productivity, low-income level and lower level of human capital.
4. High Population Growth
Low-income and middle-income countries are characterized by high population growth rate. According to UN World Population Prospects 2024 population growth in low income and middle-income countries is 2.7% and 0.7% respectively as compared to high income countries which is 0.4%.
5. Rural Economy
In most low- and many middle-income countries, a high share of the population lives in rural areas. It is estimated that in 2023, about 65% of population in low-income countries live in rural areas as compared to less than 20% in high-income countries.
6. Social Fractionalization
Low-income countries more often have ethnic, linguistic, religious, and other forms of social divisions, called “fractionalization”. It leads to social conflicts, political instability, and low economic growth.
7. Low Level of Industrialization
Developing countries have low levels of Industrialization. They have a higher share of employment and output in the agricultural sector. In developing countries more than two-thirds of the population works in agriculture as opposed to 1% to 2% in U.S, Canada and U K.
8. Geographical Location
Most of the developing countries are primarily tropical or subtropical, these countries often suffer from tropical pests and parasites, epidemic diseases such as malaria, water resource constraints, and extremes of heat.
9. Natural Resource Endowments
High income countries are often rich in natural resources such as gulf countries are oil rich. On the other hand, there are countries such as Chad, Yemen, and Haiti, where the raw materials, minerals and fertile land are relatively minimal.
10. Underdeveloped Markets
Developing countries have imperfect markets and incomplete information. These countries have a lack of legal system, infrastructure, stable currency, market information and social norms.
11. Colonial Legacy
Most developing countries were once colonies of Europe. Stolen resources is one reason why these countries are still underdeveloped.
12. External Dependence
Developing countries are mostly dependent on developed countries in the form of grants, foreign aid, technology and environmental preservation.
LQ 4; Discuss Rostow Stages of economic growth in detail.
Introduction
An American Economic historian Walter W. Rostow provided his five stages of economic development in his book “The Stages of Economic Growth” in 1960. According to Rostow, all countries must pass through five stages of growth to become developed. These stages are.
- The traditional society
- The precondition for takeoff
- The takeoff
- The drive to maturity
- The age of high mass consumption
1. The Traditional Society
- In their first stage the economies are characterized as agrarian economy in which there is subsistence farming and limited use of technology.
- The agriculture relies heavily on manual labor and traditional methods leading to low agriculture productivity and lower income per-capita.
- About more than 75% of the workforce relied on agriculture.
- Investment is less than 5% of GNP and there was limited industrial production.
2. The Preconditions for Take-off
- During this stage economies start investing on infrastructure such as roads, railways, ports, automobiles and banking.
- People adopt more productive methods in agriculture which lead to surplus output for trading.
- Exports mainly concentrated on primary and semi-finished products. Finished and capital goods are imported.
- Population growth and urbanization also begins.
- Investment rate is between 5% to 10% of GNP.
- Industrial revolution marks this stage.
3. The Take-off
- This stage is characterized by rapid industrialization and sustained economic growth.
- It is a short period that lasts for about 30 years.
- Manufacturing grows, and productivity increases dramatically. New industries are established and new innovations take place.
- The GDP growth rate is over 5% per annum.
- Structural transformation occurs from agriculture to industry.
- Entrepreneurs reinvest their profits which increase investment and reaches over 10% of the GNP.
4. The Drive to Maturity
- In this stage, the economy diversifies into new industries and living standard rises.
- There’s greater investment in infrastructure, education, and more complex industries like automobiles, electrical industries and chemical industries.
- Investment rates rise to 10% to 20% of GNP.
5. The Age of High Mass Consumption
- This stage is characterized by a shift from heavy industry to a focus on consumer goods and services.
- There are high levels of consumption of comforts and luxuries.
- The services sector becomes the largest contributor to GDP.
- The rate of investment rises significantly above 20% of GNP.
Conclusion
The United Kingdom was the first country to achieve all five stages, leading the Industrial Revolution. The USA and Western European nations followed. Countries like China and India are considered to be in the “drive to maturity” stage, with rapid industrialization, urbanization, and increasing technological progress.
Criticism
Rostow’s model is criticized for being too simplistic and assuming all countries follow the same linear path of development. It ignores differences in culture, history, institutions, and external factors like colonialism or global trade dependence.
LQ 5; Write a note on the following (a) HDI (b) PQLI.
HDI
HDI is a composite index to measure socio-economic development of a country. It was introduced by UNDP in its first human development report in 1990. It has three dimensions: Long and healthy life, Knowledge, and living standard. It ranges from 0 to 1.
There are two steps in calculating the New HDI:
- Creating separate indices for each dimension.
- Aggregating the resulting indices to produce the overall New Human Development Index (NHDI).
Creating the three-dimension indices
HDI measures development in three dimensions given below. Each dimension has maximum and minimum goalpost defined by UNDP. Dimension index for each dimension can be calculated as:
Dimension Index=(Actual Value-Minimum Value)/(Maximum Value-Minimum Value)
- Long and healthy life: It is measured by life expectancy at birth (LE).
Health Index=(LE-Min LE)/(Max LE-Min LE)
- Knowledge: It is measured by arithmetic mean of mean years of schooling (MYS) and expected years of schooling (EYS).
Education Index=(EYS+MYS)/2
- Standard of Living: It is measured by gross national income per capita (GNIPC).
Living Standard={LN(GNI PC)-LN(Min GNI PC)} / {LN(Max GNI PC)-LN(Min GNI PC)}
Aggregating the resulting indices
The UNDP then uses a geometric mean to construct the overall index, rather than an arithmetic mean.
Classification of countries based on HDI
HDI ranges from 0 to 1. UNDP classifies the countries based on their HDI value into four groups given in table below.
| Classification of Countries | HDI Range |
|---|---|
| Low Human Development | 0.0 – 0.549 |
| Medium Human Development | 0.550 – 0.699 |
| High Human Development | 0.700 – 0.799 |
| Very High Human Development | 0.80 – 1.0 |
PQLI
›Physical Quality of Life Index (PQLI) is a composite measure of socio-economic development invented by M.D. Morris in 1979. He combined three indicators including infant mortality, life expectancy at age one and basic literacy at age 15. It ranges from 0 to 100.
›Economic progress occurs if life expectancy (LE) increases, infant mortality rate (IMR) falls and basic literacy rate (BLR) increases.
Construction of PQLI
- Find the achievement level of positive indicators
Positive indicators are those variables where an increase in their value leads to an improvement in the overall PQLI. Higher values indicate better quality of life. Example: life expectancy, literacy rate.

- Find the achievement level of negative indicators
Negative indicators are those variables where an increase in their value leads to a decline in the overall PQLI. Higher values indicate poorer quality of life. Example: Infant mortality rate.

LQ 6: The process of economic development stops after the commercialization of the agricultural sector. Discuss in the light of Lewis Model.
Introduction
Lewis two sector model was developed by Arthur Lewis in 1954 which was later modified and extended by John Fei and Gustav Ranis. The Lewis two-sector model is a structural change model which states that in underdeveloped countries there is always surplus labor in the agricultural sector, thus if we withdraw this surplus labor from the agriculture sector and employ in the industrial sector, this will bring industrialization and sustained development.
The Basic Model
In the Lewis model, the underdeveloped economy consists of two sectors.
- Traditional or agriculture sector is characterized by zero marginal labor
- Modern or industrial sector characterized by high productivity.
Thus, the Lewis model focuses on two things
- Labor transfer
- Modern sector employment growth
Assumptions of the Model
- Surplus labor in agriculture
- Wage rate is determined AP of labor in agriculture sector
- Capitalists reinvest all their
- Wages in the modern sector are constant and higher than subsistence wage.
- Supply curve of rural labor to the modern sector is perfectly
Explanation Through Diagram
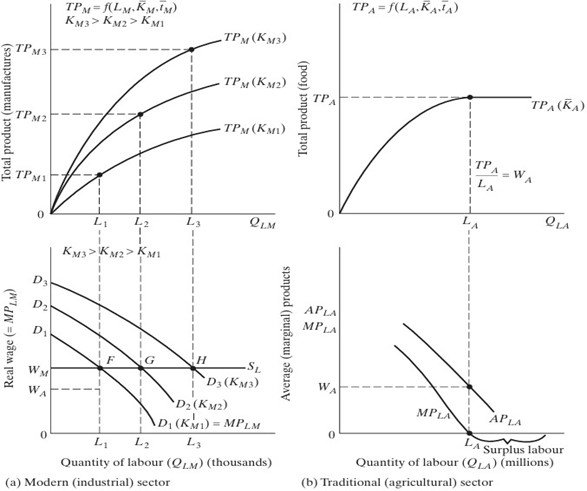
Agriculture Sector
- Upper right-hand side figure shows agriculture production function and lower right-hand side shows marginal and average products labor.
- Labor beyond 𝐿A is considered surplus because there is no increase in output after that level of labor thus, MPL becomes zero, or even negative.
- If we withdraw this surplus labor from the agriculture sector and transferred to modern sector there will be no effect on agricultural output.
- 𝑊A shows subsistence wage rate in the agriculture
Industrial Sector
- The upper left hand-side of the figure shows the manufacturing sector production function and lower left hand-side shows MP of labor.
- Initially the firm demands L1 units of labor and give wage rate equal to WM. Thus, firms total cost is OL1WMF.
- Firm demand for labor curve is also called MPL Thus, firms TR= OL1 D1F.
- Profits of the firm is equal to WMFD1 which will be reinvested, increase capital stock and shifts the production function upward.
- Thus according to Lewis, it increases employment and output in modern sector and the process of development continues until all labor is absorbed in modern sector.
Economic development stops after the commercialization of the agricultural sector (Lewis turning point)
Commercialization of agriculture begins when all surplus labor has been absorbed into the industrial sector. Beyond this point, any further transfer of labor from agriculture to industry increases wages and lowers agricultural output.
As a result, the rural labor supply curve becomes upward sloping. Firms in the industrial sector experience falling profits due to rising wage costs, leading them to reduce investment. After the commercialization of agriculture and reaching the Lewis Turning Point, the pace of economic development slows down significantly.
LQ 7; Define external debt. Discuss the causes of external debt problem of Pakistan. Also suggest its solutions.
External Debt
External debt or foreign debt refers to the money borrowed by a country from foreign lenders, including international institutions, foreign governments, and commercial banks. Pakistan, like many developing countries, relies on external borrowing to meet budget deficit, BOP deficits, development projects and stabilize foreign exchange reserves.
Causes of foreign debt crises of Pakistan
Trade deficits: When a country imports more than it exports, it creates a trade deficit. This deficit can lead to a foreign debt crisis if the country borrows money to finance its imports.
High interest rates: Countries that borrow money from other countries or organizations often pay high interest rates. Therefore in order to payoff existing debt the country borrows more.
Economic Mismanagement: Poor government policies such as excessive borrowing, overspending, high inflation, overvalued exchange rates lead to failure to generate enough revenue to repay debt.
Corruption and political instability: They leads to misuse of resources, reducing the effectiveness of economic policies, discourages investment and slows economic growth.
Poor Debt Management: Poor debt management arises when countries borrow without a clear repayment strategy. Taking excessive short-term or foreign-currency loans increases vulnerability.
External shocks: External events such as global commodity price changes, oil price hikes, or natural disasters reduce export earnings and increase import bills.
Rapid capital inflow: Globalization brought large capital inflows to developing countries. Beside their benefits, these inflows led to rapid accumulation of external debt.
Financial Contagion: Financial contagion refers to the rapid spread of financial crises from one country to another due to global interconnectedness. When investors panic in one market, they often pull-out funds from other economies as well.
Solution of foreign debt crises
Diversification of the Economy: Diversifying the economy reduces dependence on a single sector and lowers vulnerability to external shocks. This makes the economy more resilient and reduces the chances of a foreign debt crisis.
Fiscal Discipline: Fiscal discipline involves maintaining a balance between government revenues and expenditures. By reducing wasteful spending and prioritizing essential sectors.
Strengthening Institutions: Strong and transparent institutions ensure responsible use of public funds, effective financial regulation. promote accountability and reduce corruption.
Debt Restructuring: It involves new terms with creditors such as longer repayment periods, lower interest rates, or partial debt forgiveness which provide temporary relief.
LQ 8; Discuss the Solow model of economic growth.
Introduction
The Solow Growth Model is a well-known Neoclassical exogenous growth model presented by Robert Solow in 1956. This model explains that long-term economic growth depends on three factors:
- Rate of capital accumulation
- Labor force growth
- Technological progress
Assumptions of Solow Model
- Production function exhibits constant returns to scale and homogeneous of the first degree
- Labour and capital are substitutable for each other.
- Saving ratio is constant.
- Full employment of labor and capital.
- Labor force grows at constant exogenous rate.
The Model: Production Function
Solow growth model assumes diminishing returns to both K and L in the short run, while there are constant returns to scale over the longer term. The general production function can be written as:
Y= F(K, L)

If we increase capital and labor by some proportion say 10%, then output will increase by same proportion say 10%.

Where Y is GDP, K is the capital stock, L represents Labor Force, and A is the productivity growth or technological progress which is assumed to be exogenous and shifts the production function, α is capital elasticity of output and 1-α is labor elasticity of output.
Production Function in Per Worker Terms
Dividing the production function by L we get production function in per worker terms
 or
or 
Thus,

This last equation shows that output per worker y depends on the amount of capital per worker k. The more capital with each worker has, the more output that worker can produce but at a diminishing rate.
Savings and Capital Stock
Capital stock in the economy increases when savings (investment) is greater than depreciation () as well as amount of capital required to equip new workers due to increase in labor force by rate .

Equilibrium in Solow Growth Model (Steady State)
Steady State is the situation where output per worker and capital per worker remain constant overtime. To find this steady state set .
sf(k*)=(δ+n)k*
The notation k* means the level of capital per worker when the economy is in its steady state. If k is higher or lower than k*, the economy will return to it, thus k* is a stable equilibrium.
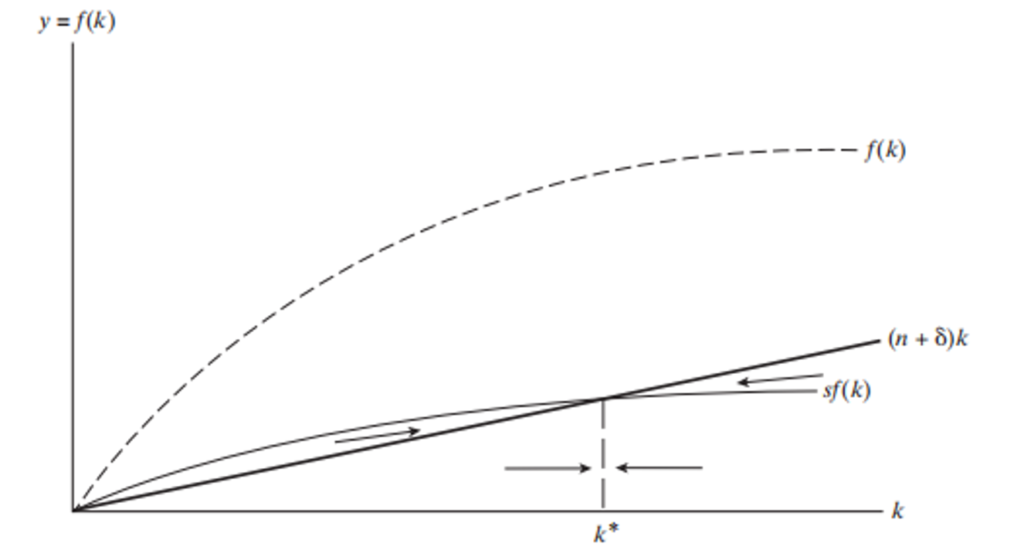
Explanation
- If k<k^*, then sf(k)>(δ+n)k, so output per worker will increase.
- If k>k^*, then sf(k)<(δ+n)k, so output per worker will fall.
- If k=k^*, then sf(k)=(δ+n)k, so output per worker remains constant (steady state).
Effect of Savings on Solow Growth Model
An increase in savings leads to temporary increase in the rate of output growth. We return to the original steady-state growth rate but at a higher level of output per worker.
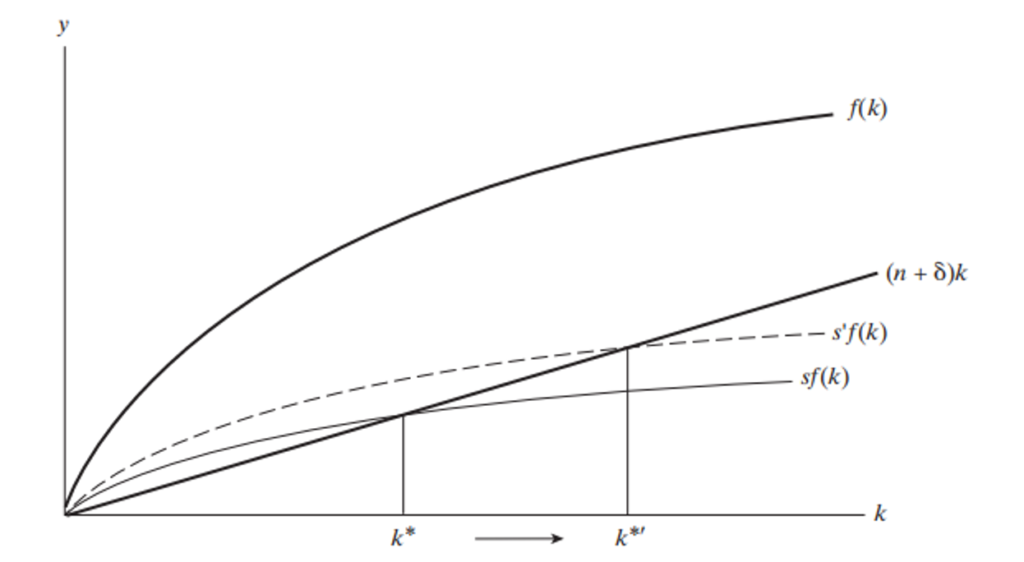
Implications
The Solow Growth Model implies that all countries will have same level of income if they have same rate of saving, labor force, depreciation and productivity growth, this is known as conditional convergence.
LQ 9; Explain the demographic transition theory in detail with diagram.
Demographic Transition
Demographic transition refers to the movement from stable population growth rates with high birth and death rates to higher population growth with declining death rates and to slower or no population growth.
Stages of Demographic Transition Theory
Demographic Transition Theory suggests that societies move through four stages of population change based on shifts in birth rates, death rates, and overall population growth as countries move from traditional agrarian economies to modern industrial societies. These stages are:
Explanation Through Diagram
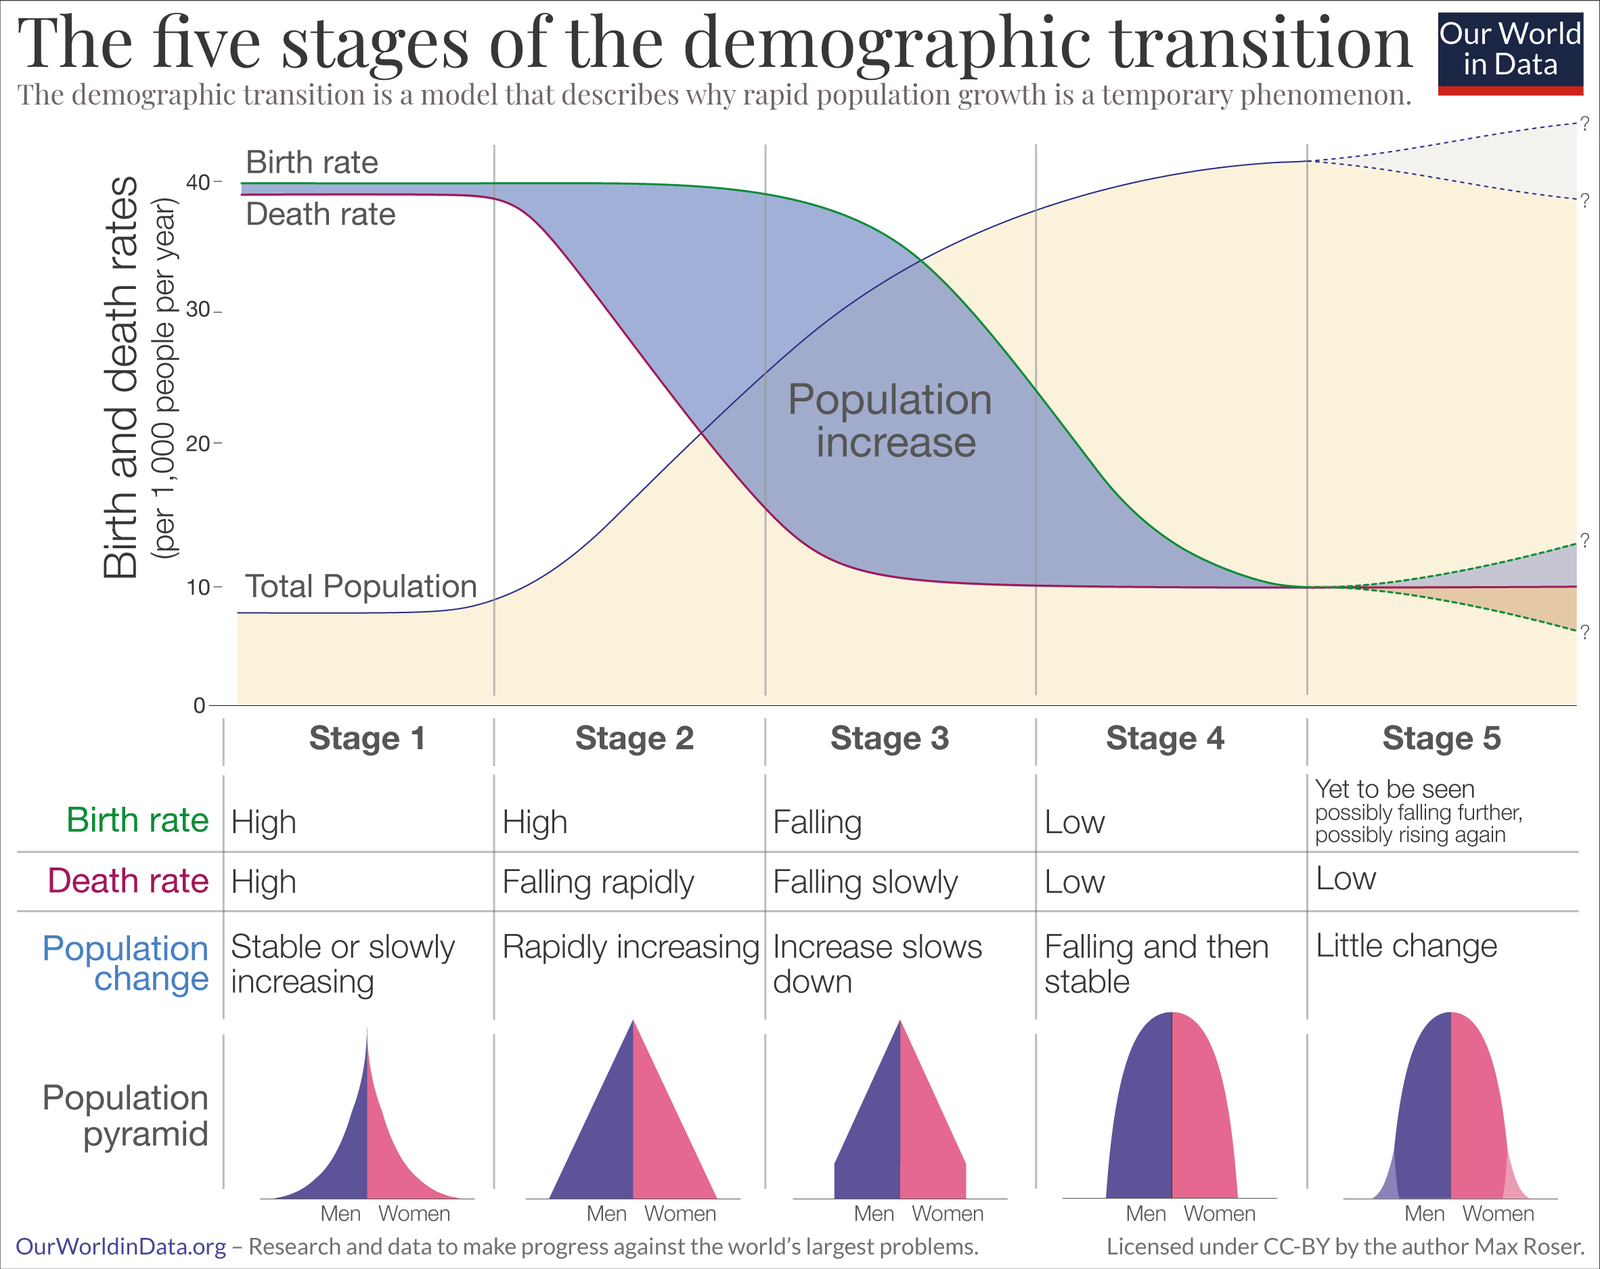
Demographic Transition in Developed Countries
Stage 1: High Fluctuating Stage
Also known as pre-industrial or pre-transitional stage.
Characteristics:
- High birth rates due to lack of contraception and agrarian economy
- High death rates caused by disease, famine, and poor sanitation
- Low life expectancy
- Stable of slow growing population
Example: Most societies before the 18th century
Stage 2: Early Expending Stage
Also known as transitional stage.
Characteristics:
- High population growth rate
- Death rates fall rapidly due to healthcare improvements and better nutrition
- Birth rates remain high
- Agricultural and technological progress increases food supply
- Population becomes youthful
- Growth rate rises (around 1% or more)
Example: Western Europe during the Agricultural Revolution
Stage 3: Late Expanding Stage
Also known as industrial or late transition stage
Characteristics:
- Birth rates decline due to urbanization and higher income
- Fertility falls with female education and employment
- Family planning becomes common
Examples: Malaysia, Mexico, Saudi Arabia
Stage 4: Low Fluctuating Stage
Also known as post-industrial or post transitional stage
Characteristics:
- Low birth and death rates
- High life expectancy
- Aging population
- Population stabilizes
Examples: Bangladesh, Argentina, India
Stage 5: Declining Population
Characteristics:
- Fertility falls below replacement level
- Population begins to shrink
- Aging society and labor shortages
- This stage is ambiguous
Examples: Japan, Italy, Germany
Conclusion
Western Europe experienced the full demographic transition by the second half of the 20th century. Birth rates declined significantly while death rates stabilized or slightly increased due to population aging. This created a shift from rapid growth to stable or declining populations. Thus,
Summary
Demographic transition describes the transformation of population growth patterns from:
- High birth and death rates with low population growth due to diseases, hunger and lack of health facilities
- Falling death rates with rapid population growth due to improvements in nutrition and sanitation
- Declining birth rates with stable or slow growth due to economic development and women education
LQ 10; Explain the Malthus Theory of Population. in detail with diagram.
The Malthus Theory of Population was proposed by Thomas Malthus an English Economist, in his book An Essay on the Principle of Population in 1798.
Core Principles of Malthusian Theory
According to him human populations grows at geometric progression (1, 2, 4, 8, 16, 32 and so on) and food production increases at arithmetic progression (1, 2, 3, 4, 5, and so on) due to limited land and technology. Thus, populations will grow faster than the supply of food, leading to food shortage, scarcity of resources and widespread poverty.
Malthusian Population Trap
The Malthusian population trap refers to a situation where population growth outpaces agricultural production, leading to widespread poverty, famine, and low living standards.
Explanation through Diagram
The Malthus population trap is explained in figure below. The vertical axis measures population growth rate and income growth rate while the horizontal axis measures the level of income per-capita.
Per capita income is the difference between income growth rate and population growth rate, the vertical difference between these two curves.
𝐼𝑛𝑐𝑜𝑚𝑒 𝑃𝑒𝑟 𝐶𝑎𝑝𝑖𝑡𝑎=𝐼𝑛𝑐𝑜𝑚𝑒 𝑔𝑟𝑜𝑤𝑡ℎ 𝑟𝑎𝑡𝑒−𝑃𝑜𝑝𝑢𝑙𝑎𝑡𝑖𝑜𝑛 𝑔𝑟𝑜𝑤𝑡ℎ 𝑟𝑎𝑡𝑒
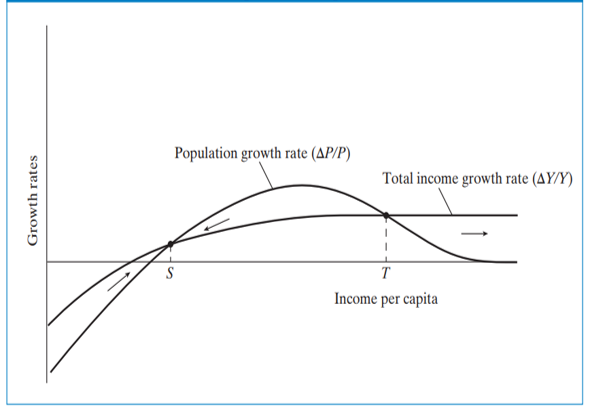
Explanation
When aggregate income is low population growth is also very low. As the income grows, the population also grows and both curves of population growth and income growth intersect each other at point S, which is the minimum subsistence level of income. According to Malthus, population grows much faster than income, that is . Thus, per-capita income decreases as shown by the arrow pointed towards S.
How to Avoid Population Trap
To avoid population trap Malthus proposed two types of checks: preventive checks and positive checks.
- Preventive checks are human-driven measuresto limit population growth by reducing fertility rates. Such as delayed marriages, celibacy, family planning, contraception, women education and empowerment etc.
- Positive checks are natural or human-induced crises that increase mortality rates to restore balance between population and resources such as famines, diseases, war, natural disasters like flood, earthquake.
- Technological progress can help increase per capita income and food supply such as use of modern technology and HYV seeds which shifts the food production curve or income per capita curve upward.
Criticisms and Limitations
Technological Advancements: Malthus ignored the use of modern technology and 1960s Green Revolution in agriculture which increased agricultural production by threefold
Global Trade: International food trade helps countries overcome local resource limits.
Demographic Transition: In many developed countries, birth rates fall as incomes rise, breaking the direct link between prosperity and population growth.
Modern Relevance of Malthusian Theory
Food Insecurity: Despite global improvements in food production, many regions still experience food shortages.
Environmental Issues Increasing population, urbanization, deforestation, burning fossil fuel are serious concerns which result in climate change and global warming affecting food production and human population.
Pandemics and Health Crises Events like COVID-19 remind us how population density can contribute to the rapid spread of diseases a form of “Malthusian check”.
LQ 11: Explain the Microeconomic Household Theory of Fertility.
Introduction
Microeconomic Household Fertility Theory states that a household behaves like an individual consumer, and children are treated as normal good. The household derives satisfaction from having children as well as from consuming other goods and services.
Utility Function
Therefore, household tries to maximize its satisfaction by making choices between the number of children and other consumer goods.


Children Demand Function
According to this theory desire or demand for children ( ) depends on household income
  , net price of the children
  , prices of other goods relative to children
  , and taste for goods relative to children
  .
.

Expected Relationships
- Desire for children is positively related to household income.

- Desire for children is inversely related to the net price of the children, Pc.


- Demand for children is positively related to the price of other goods (due to substitution effect).
 .
. - Desire for children is negatively related to the taste of goods relative to children. .
 .
. .
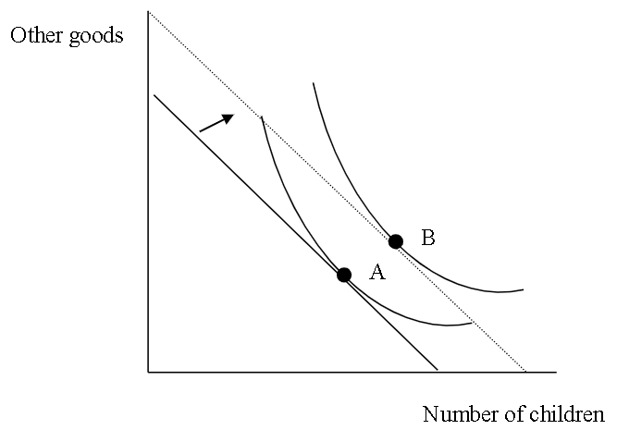
.Indifference Curve and Budget Line
Each indifference curve shows alternative combinations of child and commodity that provide same level of satisfaction to the household and higher the IC higher will be the satisfaction.
The budget constraint shows commodity-child combinations which the household can afford given the price of children and income of the household.
The slope of budget line is the price of children relative to the price of other goods. The steeper the budget line, the higher the price of children relative to other goods.

Explanation Through Diagram
Effect of Rise in Income of Household
An increase in households’ income holding price of children and price of other goods constant leads to parallel shift of budget line, allowing more consumption of commodities and children, household move to higher utility level from point A to B.
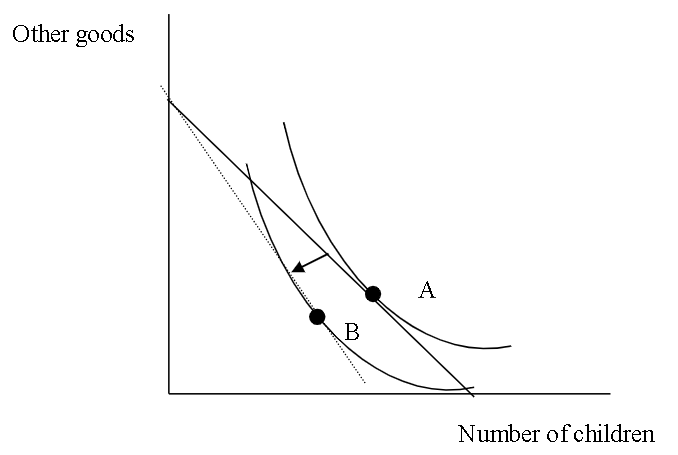
Rise in Price of Children
An increase in price of children i.e. increase in women opportunity cost (holding income and price of other goods constant) lowers demand for children, the budget line rotates inward from the X-axis and becomes steeper, and the consumer moves to lower utility level from point A to B.
Rise in Income as well as Price of Children
An increase in income as well as price of children rotates as well as shift the budget line which lowers demand for children and increases demand for other goods.
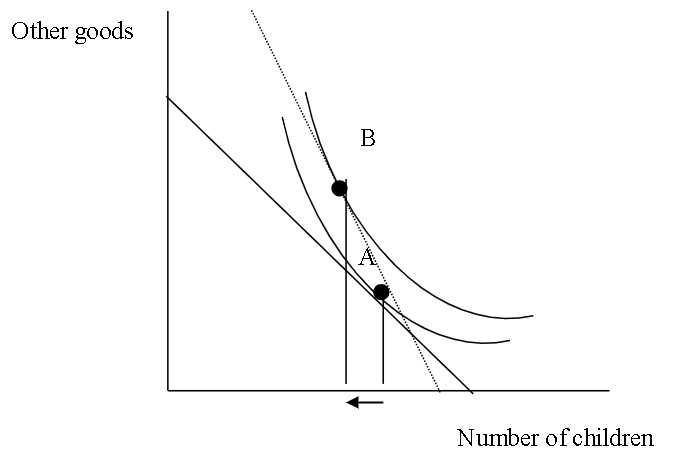
Conclusion and Policy Recommendation
Higher income combined with a rise in the cost of raising children leads households to prefer fewer but better-quality children. It is recommended to promote female employment opportunities and implement child-related taxes or incentives to help manage family size and improve child quality.
LQ 12: Discuss the costs and benefits of education.
Costs and Benefits of Education
Costs of Education
Two types of costs of education
- Private costs
- Social costs
Private Costs
Private costs refer to the direct and indirect expenses that individuals, families, or organisations incur while pursuing education. Private costs can be direct and indirect.
Direct Private cost (Out-of-Pocket Expenses)
Direct private costs or out-of-pocket expenses are the money that individuals directly pay for their education, including expenditures on:
- Challan fees
- Tuition fees
- Hostel dues
- Books & uniforms
- Transport
- Online resources
Indirect Private Cost (Opportunity Costs)
Indirect private costs are the opportunity cost of pursuing education, such as:
- Foregone earnings
- Time invested
- Delayed life milestones (buying a home or a car)
- Starting a business
- Delayed marriages, etc.
Social Costs
Social costs are the costs that are incurred by society/public/government in providing education. They are also categorised into direct and indirect social costs.
Direct Social Costs
It includes direct monetary expenditure of the government on:
- Educational infrastructure (buildings, classrooms, libraries, laboratories)
- Technology infrastructure (computers, software, online courses)
- Salaries (teaching and non-teaching staff)
- Government grants, scholarships, and bursaries
- Health services, etc.
Indirect Social Costs
It includes opportunity costs for society as a whole, such as:
- Productivity foregone — students not participating in the labour market
- Tax revenue foregone from students not working
- Pre-tax earnings are usually used as a proxy for productivity foregone
- Long-term cost of human capital formation for the nation
Benefits of Education
Private Benefits
Educational benefits accruing to individuals, families, or organisations investing in education are known as private benefits of education. These are of two types: direct and indirect private benefits.
Direct Private Benefits
These include:
- Higher lifetime earnings/income
- Greater career opportunities
- Job security and stability
- Higher social status
- Improved quality of life
Indirect Private Benefits
These are:
- Psychological satisfaction
- Movement up the socioeconomic ladder
- Better decision-making capacity
- Improved personal health awareness
- Greater civic participation
Social Benefits
Educational benefits enjoyed by the society or government from educational investment are referred to as social benefits of education. These are of two types: direct and indirect social benefits.
Direct Social Benefits
These include:
- Reduction in crime
- Improved health and nutrition
- Poverty reduction
- Increased charity
Indirect Social Benefits
These are:
- National integration
- Population control
- Inculcating productivity-related habits such as hard work, punctuality, self-reliance, etc.
- Increased capacity to save money
Investment decision on education
- Investment Decision: Individuals invest in education when expected Private Benefits > Private Costs (positive net return).
- Society invests in education when expected Social Benefits > Social Costs — justifying public funding.
LQ 13: Explain Human Capital Theory with reference to the relationship between earnings and education.
Human Capital Theory
The Human Capital Theory was proposed by Nobel laureate Gary Becker in 1964. Human capital theory suggests that investment in people`s education, health, trainings and skills increase their productivity and earnings.
Human Capital Earnings Function
The human capital earnings function estimates the effect of investments in human capital such as education, experience and training etc. on wages and economic outcomes.
Mincerian Earnings Function
The Mincerian Earnings Function proposed by Jacob Mincer, explains the relationship between an individual’s education, experience, and earnings. According to this model, the log of earnings depends on years of schooling (S), years of work experience (X) and square of years of work experience.

Explanation and Interpretation of Mincerian Earnings Function
- Natural log of earnings [(lnWagei)]: Taking the natural logarithm of earnings helps to linearise the relationship between earnings and the explanatory variables, making it easier to estimate using a linear regression model.
- Years of Schooling (Si): This variable captures the effect of formal education on earnings. The coefficient β₁ measures the rate of returns to education, and it represents the percentage increase in earnings associated with an additional year of schooling.
- Years of Experience (Xi): Work experience is another critical factor affecting earnings. The coefficient β2 measures the percentage increase in earnings for each additional year of work experience.
- Squared Term of Experience (Xi²): The inclusion of the squared term allows for the modelling of diminishing returns to experience. The coefficient β3 captures this non-linear relationship.
- Error term (u_i): This term captures the effect of unobserved factors on the log of wages that are not included in the model.
Relationship between education and earnings
Education is the primary vehicle for human capital accumulation. Investment in human capital especially education, generates expected future income over years. This expected income can be calculated by the following formula:

Where E is income with extra education, N is income without extra education, t is year, i is the discount rate used to convert future value into present value, and it is summed over expected years of working life.
Explanation through diagram
Diagram
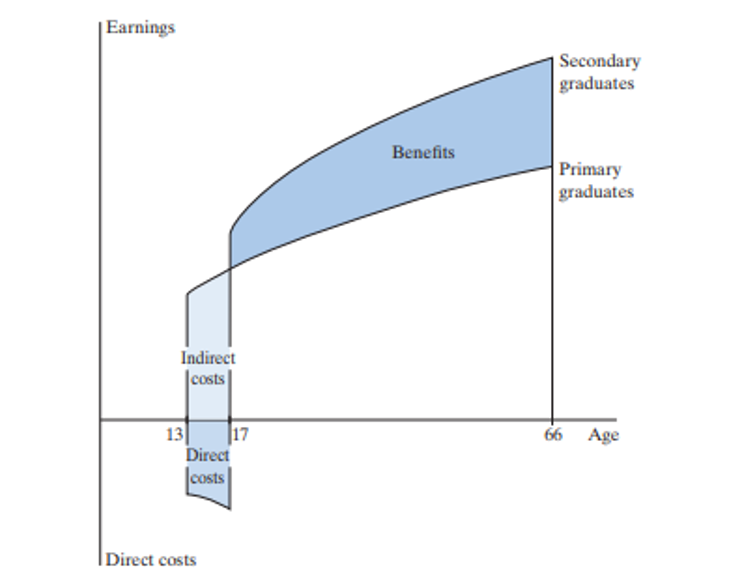
Explanation
The above diagram shows that those individuals who start earnings at an early age with primary education say at 13 years earn less than those who start earnings at a later age say 17 years with secondary education. The difference between earnings of primary and secondary graduates is called net benefits of education which is increasing overtime.
LQ 14; Write a note on the following (i) Green Revolution, (ii) Sustainable Development
Green Revolution
Green revolution is the large increase in production of food grains, especially wheat and rice in developing countries during 1960s achieved by using modern agricultural techniques, fertilizers, pesticides and high yielding varieties (HYV. It is also called the Third Agricultural Revolution.
Positive Impacts of Green Revolution
- Alleviated Food Shortage: The green revolution has significantly increased global agriculture production which alleviated hunger and poverty and improves food security.
- Rural Development: It increases the per acre yield which increase farmers income and their living standard and increased rural development.
- Source of Foreign Exchange: Significant increase in production of wheat and rice led countries earn foreign reserves.
- Reduced Food Prices: Increased supply led to reduced food prices.
Negative Impacts of Green Revolution
- Environmental Degradation: Overuse of chemical fertilizers and pesticides led to soil degradation, water pollution, and loss of soil fertility.
- Socio-Economic Inequality: Increased disparity between rich and poor farmers because only rich farmers can adopt new seeds, fertilizers and new machinery etc.
- Health Risks: Excessive and improper use of agrochemicals caused health problems for farm workers and rural communities.
- Rural Unemployment: Mechanization and large-scale farming reduced the need for manual labor leading to rural unemployment and rural-urban migration.
Sustainable Development
Definition:
The World Commission on Environment and Development in 1987 defined sustainable development as “meeting the needs of the present generation without compromising the ability of future generations to meet their own needs.”
It emphasizes sustainable improvement in the quality of life of all people through increases in real income per capita, improvements in education, health and general quality of life and improvements in quality of natural environmental resources.
4 Pillars of Sustainable Development
The four core elements of sustainable development known as the pillars of sustainability are human, social, economic, and environmental.
- Human Sustainability: It aims to maintain and improve the human capital in society.
- Environmental sustainability: It is the ability to preserve and protect the natural environment over time through appropriate policies.
- Social sustainability: Social sustainability involves ensuring that all people have access to basic services like education, healthcare, and housing,
- Economic sustainability: Improvement in long-term economic well-being. It includes inclusive growth, equality etc.
Sustainable Development Goals (SDGs):
The Sustainable Development Goals are the set of 17 global goals adopted by the UN member countries in September 2015 to be achieved by 2030, aiming to eradicate multidimensional poverty and improve the quality of life. For example, some of these goals are: No poverty, zero hunger, clean water and sanitation, gender equality etc.
LQ 15: Discuss the Big Push theory of economic development.
Introduction
The Big Push Theory states that underdeveloped economies require a large-scale and coordinated investment across multiple sectors to overcome indivisibilities, market failures, and low-level equilibrium traps, and achieve self-sustaining growth.
Introduced by Paul Rosenstein-Rodan in 1943, this theory argues that isolated investments are insufficient due to interdependence between industries and market failures.
Core Concepts of the Theory
Indivisibilities and Economies of Scale
The theory highlights the importance of economic indivisibilities which states that a large-scale and coordinated investment is necessary which require large upfront costs but generate long-term benefits and economic growth.
Interdependence and Externalities
Industries depend on each other for inputs and demand. An automobile industry, for instance, creates demand for industries that provide them with inputs like steel, rubber, glass, and plastic parts (backward linkage). Coordinated investments ensure these linkages and create positive externalities.
Role of Government
Governments must lead the “big push” by funding infrastructure, providing subsidies, and coordinating private-sector activities.
Multiplier Effects
Investments in infrastructure and industry create ripple effects-e.g., new factories employ workers, who then spend their earnings locally, stimulating demand for local services and goods necessary for growth of local industries.
Applications of the Big Push theory
1. South Korea’s Rapid Industrialization (1960s–1970s)
South Korea is a leading example of the Big Push Theory. During the 1960s and 1970s, the government implemented large-scale, coordinated investments in infrastructure, education, and key industries such as steel, shipbuilding, and electronics.
2. Marshall Plan in Western Europe (1948–1952)
After World War II, the U.S. launched the Marshall Plan, providing USD 12 billion to rebuild Europe’s infrastructure, industry, and agriculture through coordinated capital aid.
3. Green Revolution (1940s–1960s)
The Green Revolution applied Big Push strategies in agriculture including coordinated investments in high-yield crop varieties, fertilizers, irrigation, and rural infrastructure.
Criticism/Demerits of Big Push theory
- Neglects Agriculture Sector: The Big Push theory led heavy emphasis on the industrial and infrastructure sector but ignored the agriculture sector.
- High Upfront Cost: The Pig Push requires heavy initial investment in multiple sectors which is beyond the capacity of most developing countries due to lack of capital and savings.
- Risk of Inefficiency and Misallocation: Large scale and coordinated investment requires efficient management and detailed planning without which resources may be misallocated.
- Poor Governance and Institutions: Weak institutions, corruption, and lack of skilled manpower can lead to ineffectiveness of the strategy.
- Limited Role for the Private Sector: The theory underestimates the potential contribution of the private sector in mobilizing savings and driving investment.
- Potential for Inflation and Economic Instability: Rapid, large-scale investments can lead to inflationary pressures.


 MinhajMetricsHub